Chapter 9A Process Capability and Statistical Quality Control (SQC)
Chapter 9A Process Capability and Statistical Quality Control (SQC). Flower Platoon Abad.Imperial.Javate . Palma.Uy,R ., Valencia. OBJECTIVES. Process Variation Process Capability Process Control Procedures Variable data Attribute data Acceptance Sampling Operating Characteristic Curve.


Chapter 9A Process Capability and Statistical Quality Control (SQC)
E N D
Presentation Transcript
Chapter 9AProcess Capability and Statistical Quality Control (SQC) Flower Platoon Abad.Imperial.Javate. Palma.Uy,R., Valencia
OBJECTIVES • Process Variation • Process Capability • Process Control Procedures • Variable data • Attribute data • Acceptance Sampling • Operating Characteristic Curve
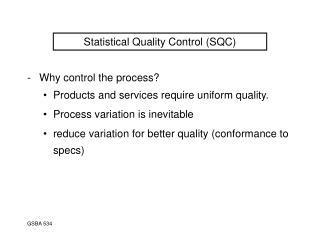
Introduction • Statistical quality control (SQC) • Quantitative aspects of quality management • How well are we doing at meeting the specifications that were set for the design? • Requires periodic sampling of processes and analysis • Use statistically derived performance criteria • Applications • Manufacturing • Ex. Manufacturing defects • Service • Ex.
Basic Forms of Variation • Assignable variation • caused by factors that can be clearly identified and possibly managed • Ex. 1pt, different anthropometric measurements • Common variation • inherent in the production process • Ex. Donuts
Variation • As variation is reduced, quality is improved • However, it is also impossible to have zero variability • Solution: Define the target + acceptable limits about the target • Upper and Lower specification limits • Ex. 10 inches + 0.02 inches
High High Incremental Cost of Variability Incremental Cost of Variability Zero Zero Lower Spec Target Spec Upper Spec Lower Spec Target Spec Upper Spec Traditional View Taguchi’s View Traditional View VS Taguchi’s View Within LS and US is good Cost is 0 if w/in range Quantum leap if limit violated Graduation of acceptability away from aim Costs increases as variability increases Seek to achieve zero defects minimize quality costs
Process Capability • Evaluate the ability of a production process to meet or exceed preset specifications • Ex. Motorola Six-Sigma Limits • When is a Process CAPABLE? • Mean and SD of process are operating such that UCL and LCL are acceptable relative to specification limits
Process Capability Index, Cpk • Shows how well parts being produced fit into the range specified by design limits • Position of the mean and tails of the process relative to design specifications • More off center, more defective parts produced
Example • Design Specifications: acceptable volume of liquid is preset at 16 ounces + .2 ounces • 15.8 (Lower) and 16.2 ounces (Upper)
Capability Index • Cp=1 • process variability just meets specifications • Minimally capable • Cp <1 • process variability outside range of specification • Not capable of producing w/in specification, NI • Cp >1 • process variability tighter than specifications • Exceeds minimal capability
Sample problem: • The quality assurance manager is assessing the capability of a process that puts pressurized grease in an aerosol can • Design specification call for an average of 60 pounds per square inch (psi) of pressure in each can • W/ ULT of 65 ps and LLT of 55 psi • Sample taken from production, average 61 psi w/ SD 2 psi • What is the capability of the process? • What is probability of producing a defect?
Sample problem • Given • LTL 55, UTL 65, X = 61, Sigma = 2 • Calculate the Cp • Cp = Min 61-55 x 65-61 3(2) 3(2) Cp = min 1 x 0.6667 = 0.6667 (*Cp <1, not capable of producing w/in specification)
Calculate probability of producing a defect • Probability of a can w/ <55psi • Z = LTL – Mean/σ • Z = 55-61/2 = -3 • Use Appendix E, p 745 • NORMDIST (-3) = 0.00135 • Probability of a can >65 psi • Z = UTL – Mean/σ • Z = 65-61/2 = 2 • 1 – NORMDIST(2) = 1-.97725 = 0.02275
Probability of a can <55 or >65 psi • Probability = 0.00135 + 0.02275 = 00.0241 • Approximately 2.4% of cans will be defective
Types of Statistical Sampling • Attribute (Go or no-go information) • Defectives • acceptability of product across a range of characteristics. • Defects • number of defects per unit which may be higher than the number of defectives. • p-chart application • Variable (Continuous) • Usually measured by the mean and the standard deviation. • X-bar and R chart applications
Control Limits are based on the Normal Curve! x m z -3 -2 -1 0 1 2 3 Standard deviation units or “z” units.
x Control Limits We establish the Upper Control Limits (UCL) and the Lower Control Limits (LCL) with plus or minus 3 standard deviations from some x-bar or mean value. Based on this we can expect 99.7% of our sample observations to fall within these limits. 99.7% LCL UCL
Statistical Process Control (SPC) Charts UCL Normal Behavior LCL 1 2 3 4 5 6 Samples over time UCL Possible problem, investigate LCL 1 2 3 4 5 6 Samples over time UCL Possible problem, investigate LCL 1 2 3 4 5 6 Samples over time
P-Chart Example • Page 349, #3 • Ten Samples of 15 parts each were taken from an ongoing process to establish a p chart for control. The samples and the number of defectives in each are shown as follows:
A. Develop a p chart for 95% (1.96 SD) • B. Based on the planned data points, what comments can you make?
What we need! Number of defects found in each sample Sample No. No. of Samples
Statistical Process Control Formulas:Attribute Measurements (p-Chart) Given: Observations: Number of samples x Sample size Compute control limits:
Constructing a p-chart Calculate the sample proportions, p for each sample
Constructing a p-chart Calculate the average of the sample proportions Calculate the standard deviation of the sample proportion
Constructing a p-chart • Calculate the control limits UCL = 0.194 LCL = - 0.060
Constructing a p-chart • Plot the individual sample proportions, the average of the proportions, and the control limits UCL LCL
Conclusion • Control limits were established as 95 percent • Of the 10 Samples, 2 were out of the control limits • Process is out of control and warrants an investigation
X-bar and R Charts Example • P. 349 #6 • Resistors for electronic circuits are manufactured on a high speed automated machine. The machine is set up to produce a large run of resistors of 1,000 ohms each • To set up the machine and to create a control chart to be used throughout the run, 15 samples were taken with four resistors in each samples
Develop an x chart and an R chart and plot the values. • From the charts, what comments can you make about the process? (Use three-sigma control limits as in Exhibit 9A.6)
Calculate sample means, sample ranges, mean of means, and mean of ranges.
Determine Control Limit Formulas and Necessary Tabled Values From Exhibit 9A.6 p.341
R Chart UCL LCL
Conclusion • All the points are well within the control limits • The process is controlled
Acceptance Sampling • Acceptance Sampling • sampling to accept or reject the immediate lot of product at hand • What percentage of products conform to specifications?
Acceptance Sampling: Single Sampling Plan • Determine (1) n - how many units to sample from a lot (2) c - the maximum number of defective items that can be found in the sample before the lot is rejected
4 factors influencing n and c • Acceptable Quality Level (AQL) • Max. acceptable percentage of defectives defined by producer • The α (Producer’s risk) • The probability of rejecting a good lot • Lot Tolerance Percent Defective (LTPD) • Percentage of defectives that defines consumer’s rejection point • The (Consumer’s risk) • The probability of accepting a bad lot
Example, p344 • Hi-Tech industries manufactures Z-band radar scanners to detect speed traps • Circuit boards in scanners purchased from outside vendor • Vendor produces boards to an AQL of 2% defectives • Willing to run 5% risk (or less) (α) of having defective lots rejected • Hi-Tech considers • Lots of 8% (or more) (LTPD) defectives unacceptable • Wants to ensure that no more than 10% poor quality lot is accepted
Determine n and c • Given • AQL = 0.02, α= 0.05, LTPD = 0.08, β = 0.10 • Get c, Divide LTPD by AQL • 0.08/0.02 = 4
Use sampling plan table for α = 0.05, β = 0.10 • Get c, find the ratio (in column 2) that is equal or greater than 4 (4.057 associated w/ c = 4) • nAQL/AQL; Find value in column 3 (nAQL) that is the same with c=4, divide by AQL 1.970/0.02 = 98.5 n = 99
Sampling plan • c = 4, n = 99 • Take a random sample of 99 units from a lot • Reject the lot if more than 4 units are defective
1 0.9 a = .05 (producer’s risk) 0.8 0.7 n = 99 c = 4 0.6 0.5 Probability of acceptance 0.4 =.10 (consumer’s risk) 0.3 0.2 0.1 0 1 2 3 4 5 6 7 8 9 10 11 12 AQL LTPD Percent defective Operating Characteristic Curve The OCC brings the concepts of producer’s risk, consumer’s risk, sample size, and maximum defects allowed together The shape or slope of the curve is dependent on a particular combination of the four parameters
Bonus Problem • P. 350, #10 • The state and local police departments are trying to analyze crime rates so they can shift their patrols from decreasing rate areas to areas where rates are increasing. The city and county have been geographically segmented into areas containing 5000 residences. The police recognizes that not all crimes and offenses are reported. • Every month, because of this, the police are contacting by phone a random sample of 1000 of the 5000 residences for date on crime.
Construct a p chart for 95% Confidence (1.96) and plot each of the months • If the next three months show crime incidences in this area as: • January = 10 • February = 12 • March = 11 • Comment on the crime rate
Calculate the average of the sample proportions Calculate the standard deviation of the sample proportion
Constructing a p-chart • Calculate the control limits UCL = 0.014 LCL = 0.002