STATISTICAL PROCESS CONTROL AND QUALITY MANAGEMENT
STATISTICAL PROCESS CONTROL AND QUALITY MANAGEMENT. Quality. Fitness for use, acceptable standard Based on needs, expectations and customer requests. Types of Quality. Quality of design Quality of conformance Quality of performance. Quality of Design.


STATISTICAL PROCESS CONTROL AND QUALITY MANAGEMENT
E N D
Presentation Transcript
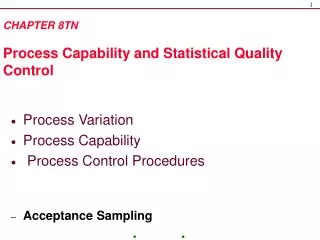
Quality • Fitness for use, acceptable standard • Based on needs, expectations and customer requests Types of Quality • Quality of design • Quality of conformance • Quality of performance
Quality of Design • Differences in quality due to design differences, intentional differences Quality of Conformance • Degree to which product meets or exceeds standards Quality of Performance • Long term consistent functioning of the product, reliability, safety, serviceability, maintainability
Quality and Productivity • Improved quality leads to lower costs and increased profits
Statistics and Quality Management • Statistical analysis is used to assist with product design, monitor the production process, and check quality of the finished product
Checking Finished Product Quality • Random samples selected from batches of finished product can be used to check for product quality
Assisting With Production Design • A variety of experimental design techniques are available for improving the production process
Monitoring the Process • Control charts is used to monitor the process as it unfolds • Sampling from the production line to see if variation in product quality is consistent with expectations
The Control Chart • A special type of sequence plot which is used to monitor a process • Throughout the process measurements are taken and plotted in a sequence plot • Plot also contains upper and lower control limits indicating the expected range of the process when it is behaving properly
Variation • There is no two natural items in any category are the same. • Variation may be quite large or very small. • If variation very small, it may appear that items are identical, but precision instruments will show differences.
3 Categories of variation • Within-piece variation • One portion of surface is rougher than another portion. • Apiece-to-piece variation • Variation among pieces produced at the same time. • Time-to-time variation • Service given early would be different from that given later in the day.
Source of variation • Equipment • Tool wear, machine vibration, … • Material • Raw material quality • Environment • Temperature, pressure, humadity • Operator • Operator performs- physical & emotional
Control Chart Viewpoint • Variation due to • Common or chance causes • Assignable causes • Control chart may be used to discover “assignable causes”
Control chart functions • Control charts are powerful aids to understanding the performance of a process over time. PROCESS Output Input What’s causing variability?
Control charts identify variation • Chance causes - “common cause” • inherent to the process or random and not controllable • if only common cause present, the process is considered stable or “in control” • Assignable causes - “special cause” • variation due to outside influences • if present, the process is “out of control”
Control charts help us learn more about processes • Separate common and special causes of variation • Determine whether a process is in a state of statistical control or out-of-control • Estimate the process parameters (mean, variation) and assess the performance of a process or its capability
Control charts to monitor processes • To monitor output, we use a control chart • we check things like the mean, range, standard deviation • To monitor a process, we typically use two control charts • mean (or some other central tendency measure) • variation (typically using range or standard deviation)
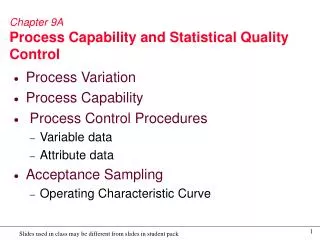
Types of Data • Variable data • Product characteristic that can be measured • Length, size, weight, height, time, velocity • Attribute data • Product characteristic evaluated with a discrete choice • Good/bad, yes/no
Types of Control Charts • Control Chart For The Mean(X chart) • Control Chart For The Range(R chart) • Control Chart For A Proportion(p chart) • Control Chart For Attribute Measures(c chart)
Control Chart For The Sample Mean • Assuming that the sample mean is approximately normal with mean and standard deviation , a control chart for the mean usually consists of three horizontal lines • The vertical axis is used to plot the magnitude of observed sample means while the horizontal axis represents time or the order of the sequence of observed means
Control Chart For The Sample Mean • The center line is at the mean, and upper and lower control limits are at • +3 and -3 • Since (standard deviation)is usually unknown the • term is usually replaced by an estimator based on the sample range
Control Chart For The Sample Mean The formula is given by where = average value of the range = k = number of samples The values of A2 depend on the sample size
Control Chart For The Sample Mean • LCL = • UCL =
Control Chart For The Range • Designed to monitor variability in the product • Range easier to determine than standard deviation • Distribution of sample range assumes product measurement is normally distributed
Control Chart For The Range • Upper and lower control limits and center line obtained from and the values of D3, D4 • according to the formulae • LCL = • UCL = • The values of D3, D4 are based on sample size
Control Chart For The Sample Proportion • Population proportion • The sample mean is now a mean proportion given by • Where = total number of objects in sample with characteristic divided by total sample size
Control Chart For The Sample Proportion • Using the central limit theorem the control limits are given by:
Control Chart For The Sample Proportion • Since the true proportion is usually unknown we replace it by the average proportion • If the sample size varies then the upper and lower limits will vary and the equations become: • where ni = sample size in sample i
Control Chart For Attribute Measures • Alternative method of counting good and bad items. • Defects are measured by merely counting the no. of defects. • Where c = total number of defects in a sample
Control Chart For Attribute Measures • Process average or central line c= • UCL: • LCL:
Example: Control Charts for Variable Data Slip Ring Diameter (cm) Sample 1 2 3 4 5 X R 1 5.02 5.01 4.94 4.99 4.96 2 5.01 5.03 5.07 4.95 4.96 3 4.99 5.00 4.93 4.92 4.99 4 5.03 4.91 5.01 4.98 4.89 5 4.95 4.92 5.03 5.05 5.01 6 4.97 5.06 5.06 4.96 5.03 7 5.05 5.01 5.10 4.96 4.99 8 5.09 5.10 5.00 4.99 5.08 9 5.14 5.10 4.99 5.08 5.09 10 5.01 4.98 5.08 5.07 4.99
Example: Control Charts for Variable Data Slip Ring Diameter (cm) Sample 1 2 3 4 5 X R 1 5.02 5.01 4.94 4.99 4.96 4.98 0.08 2 5.01 5.03 5.07 4.95 4.96 5.00 0.12 3 4.99 5.00 4.93 4.92 4.99 4.97 0.08 4 5.03 4.91 5.01 4.98 4.89 4.96 0.14 5 4.95 4.92 5.03 5.05 5.01 4.99 0.13 6 4.97 5.06 5.06 4.96 5.03 5.01 0.10 7 5.05 5.01 5.10 4.96 4.99 5.02 0.14 8 5.09 5.10 5.00 4.99 5.08 5.05 0.11 9 5.14 5.10 4.99 5.08 5.09 5.08 0.15 10 5.01 4.98 5.08 5.07 4.99 5.03 0.10 50.09 1.15
Calculation From Table above: • Sigma X-bar = 50.09 • Sigma R = 1.15 • m = 10 Thus; • X-Double bar = 50.09/10 = 5.009 cm • R-bar = 1.15/10 = 0.115 cm Note: The control limits are only preliminary with 10 samples. It is desirable to have at least 25 samples.
Trial control limit • UCLx-bar = X-D bar + A2 R-bar = 5.009 + (0.577)(0.115) = 5.075 cm • LCLx-bar = X-D bar - A2 R-bar = 5.009 - (0.577)(0.115) = 4.943 cm • UCLR = D4R-bar = (2.114)(0.115) = 0.243 cm • LCLR = D3R-bar = (0)(0.115) = 0 cm For A2, D3, D4: see Table B, Appendix n = 5
3-Sigma Control Chart Factors Sample size X-chart R-chart nA2D3D4 2 1.88 0 3.27 3 1.02 0 2.57 4 0.73 0 2.28 5 0.58 0 2.11 6 0.48 0 2.00 7 0.42 0.08 1.92 8 0.37 0.14 1.86
LSL USL Mean -3 -2 -1 +1 +2 +3 68.26% 95.44% 99.74% -3 +3 CL The Normal Distribution = Standard deviation
34.13% of data lie between and 1 above the mean (). • 34.13% between and 1 below the mean. • Approximately two-thirds (68.28 %) within 1 of the mean. • 13.59% of the data lie between one and two standard deviations • Finally, almost all of the data (99.74%) are within 3of the mean.
Normal Distribution Review • Define the 3-sigma limits for sample means as follows: • What is the probability that the sample means will lie outside 3-sigma limits? • Note that the 3-sigma limits for sample means are different from natural tolerances which are at
Process Out of Control • The term out of control is a change in the process due to an assignable cause. • When a point (subgroup value) falls outside its control limits, the process is out of control.
Assignable Causes (a) Mean Average Grams
Assignable Causes Average (b) Spread Grams
Assignable Causes Average (c) Shape Grams
Control Charts Assignable causes likely UCL Nominal LCL 1 2 3 Samples


![Seven Quality Tools [Statistical Process Control]](https://cdn3.slideserve.com/6416179/seven-quality-tools-statistical-process-control-dt.jpg)