Download
1 / 164
1.66k likes | 1.88k Vues
Day 5, Part 1 Basic Principles and Techniques of Productivity, Quality and Cycle Time Management. Software Project Planning and Management. Dr. Dennis J. Frailey Principal Fellow Raytheon Company. The Overall Planning Cycle. Manage Risks. Analyze Job. Generate Initial Plans. Generate

E N D
Day 5, Part 1Basic Principles and Techniquesof Productivity, Quality and Cycle Time Management Software Project Planning and Management Dr. Dennis J. Frailey Principal Fellow Raytheon Company
The Overall Planning Cycle Manage Risks Analyze Job Generate Initial Plans Generate Detailed Plans Execute Measure, Manage Productivity and Quality
Outline • The basic principles of productivity • Customer value and value-added analysis • Principles of cycle time improvement
Productivity is ... The quality or state of being productive Webster’s 9th New Collegiate Dictionary Productive: Having the power of producing; Yielding or furnishing results, benefits, or profits Webster’s 9th New Collegiate Dictionary
Productivity is NOT being ... • Busy • Industrious • Virtuous • Wealthy • Hardworking • etc. Productivity has to do with results (what and how much you produce), not with the means or methods of production or the characteristics of the producer
Output Productivity = Input or Investment Measuring Productivity • Productivity is usually measured in terms of how much you produce in relation to how much you invest
Productivity Measures • Products produced per labor hour • Return on investment • Bushels of grain per acre of land • Modules tested per week • Requirements validated per day A farmer who invents a new method of growing that doubles the output per acre would be more productive than a farmer who works longer hours and doubles output per acre.
Efficiency • Productivity is a measure of how efficient your process is • Thus the way you improve productivity is to make the process more efficient • Many principles of quality engineering and cycle time improvement are directly related to productivity improvement
Work in Process (WIP) • WIP or “work in process” is work in the midst of being done • code being tested • specifications being written • objects being designed • Excess WIP is work waiting to be done that is not being done -- waiting in queues instead • something is holding up the process
Excess “Work in Process” is aKey Symptom Excess WIP is a symptom of low productivity, long cycle time, and process inefficiency Another key symptom is non-value-added work. This will be addressed later.
Excess WIP Usually Implies a Constraint or Bottleneck • When work is waiting to be done, it means that there is something holding it up • Usually this is some kind of limitation on resources or other form of process constraint
What Is a Constraint? • A constraint (bottleneck) is any resource with capacity less than the demand placed upon it • This could be a person, a computer, a network, a machine, etc. • The constraint regulates the output rate of the entire process
Why Is ConstraintManagement Important? • Improving a constraint provides capacity increase, often without capital investment • Management provides flexibility to respond to changes in customer demand • Reduces product cost as a result of increased output and improved efficiency Hiking Boys Story
Where Are Your Resources Focused? If 100 people each worked to increase capacity by 1% on 100 different parts of the software development process, the 1 person working on the constraint would save the company thousands more than all the other 99 people combined!
Effective Utilization Before deciding to take actions to improve the constraint, we must first understand the concept of effective utilization
TIME REQUIRED R EFFECTIVE UTILIZATION = = A TIME AVAILABLE Effective Utilization Defined REQUIRED (R) AVAILABLE (A) UNAVAILABLE 24 HOURS Focus on decreasing ”R" and increasing “A” I.e., decrease effective utilization!
Effective Utilization -vs- Productivity • Webster’s definitions: • Utilize: To make use of • Busy: Constantly active or in motion • Productive: Yielding or furnishing results, benefits or profits We tend to measure utilization by how busy we are, BUT utilization tells us little about how productive we are.
Why Reduce EffectiveUtilization? Running assets at a high effective utilization requires a costly cycle time trade off WIP or CYCLE TIME 100% EFFECTIVE UTILIZATION per Erlang, 1917 (see Gross and Harris, pp 10-11, 101-102)
Examples • Network performance vs load • Traffic flow vs load on freeway • Computer response vs load • Telephone dial tone delay vs load • etc.
Utilization vs Productivity • High effective utilization will cause delays (cycle time) to increase greatly (increase investment) while output is increased only marginally, thus lowering productivity of the system • Lower utilization means the resource is available when needed most, thus reducing delays and raising productivity of the overall system
Example - Firemen • Why are firemen usually sitting around the fire station, essentially idle? • Because they are needed ASAP when there is a fire.
Effective Utilization And the Constraint • Reducing effective utilization is especially critical at the constraint, because it determines the performance of the system as a whole • To minimize effective utilization, we must make our assets more productive • This does not necessarily mean that they are busier!
Ways to Improve Efficiencyat the Constraint • Repair analysis improves our ability to repair and maintain the constraint, so we can improve its availability (increase “A”) Repairman Story
More Ways to Improve Efficiencyat the Constraint • Flow balancing allows us to effectively increase tool availability (increase “A”) • Flow variability to the constraint increases the probability of the constraint running dry • Flow management helps control variability • Statistical process control techniques can decrease required processing time as well as increase tool availability (decrease “R”, increase “A”)
What Constitutes Customer Value? • Customer value is the real target of any competitive business • The exact definition depends on the customer and the market • Sizzle vs steak • Features vs ease of use • Cost of operation vs comfort and safety
Defining Value • Correctly defining value is the first step of customer satisfaction • Cut out the tasks or features that do not directly or indirectly contribute to value • They add cost but do not provide appropriate benefit
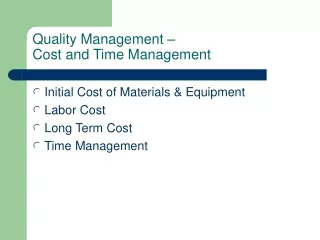
Dimensions of Customer Value • Low Costs / High Productivity • Product development/manufacturing efficiency • Attractive price • High Quality • Customer satisfaction • Reliability & few defects • Short Cycle Time • Rapid product development • Response to orders
Customer Value Productivity Cycle Time Quality The Goal • Improve all components of the customer value triangle
Without Process Change ... • You can improve any one at the expense of the others High Quality and Low Cost, but Slow Fast, Cheap, but Shoddy High Quality, but Slow and Costly
By Changing Process & Culture ... … you can improve all together Satisfactory Value Good Value Better Value Even Better Value
Weinberg’s Definition of Quality “Quality is value to someone” • In Weinberg’s sense, value is quality • And the cost to produce value is the cost of quality • But the term “cost of quality” is usually used in a different context, to describe tasks we execute that improve quality • Keep this in mind as we continue in this course
Who Produces Value? • Value is the result of the best software engineers doing their best work. • So software engineers produce value - and quality!
WHAT ARE THE COSTS OF SOFTWARE DEVELOPMENT? Total Costs Value-Added Non-Value-Added Essential Non Essential
Value-Added Costs Costs for tasks performed ... • Materials (e.g.., paper, software) • Labor hours (salaries) • Capital equipment (workstations, facilities) … that produce value • Products • Customer satisfaction • Future labor that will not be expended • e.g.., reduced maintenance and repair
The Strict Definition of“Value-Added” • Any activity that is part of the process is considered a value-added activity if it meets three criteria: • 1) Must change the product in some way • 2) Must make the product more desirable to the customer (i.e., the customer wants the change) • 3) Must be done right the first time
The Strict Definition • This very strict definition helps us open our minds • So we identify the proper targets for process improvement. • Anything that is not value-added is a suitable target for removal or improvement.
Things Not Part of Value-Added • Features the engineer thinks are nice but the customer doesn’t care about • Moving a product around • Translating between incompatible tools • Repairing mistakes • Tests and inspections • Most management activities • Activities unrelated to the process • Many other things we tend to think of as “necessary” or “desirable” • And some of them are necessary!
Some Non-Value-Added Activities • Management • Quality Assurance • Testing • ... The term “value-added” is used to help us improve our processes. It is not meant to imply that the above tasks are not valuable or that the people who do them are dispensable.
Non-Value-Added Essential • Costs for tasks performed because the process is not perfectly efficient • Peer reviews • Evaluations, inspections, verification and validation • Metrics collection, storage and analysis • Extra reviews and verifications required by customer or company policy (usually because of past problems) • Certain overhead costs (benefits, support activities)
Why are they Essential? • They would not be necessary in a perfect world • But they are necessary with our current methods of product development and our current level of product development knowledge Every process has some essential, non-value-added elements
Another Perspective • Non-value-added but essential tasks are things we might wish we did not have to do • But if we did not do them, things would be worse. • However, we still can study them to find out how to minimize them, optimize them, and improve them
Non-Value-Added, Not Essential • Tasks that are not value-added and that are not essential • Typically, these are tasks that we perform because we have not really optimized our processes • For example, things we have always done but no longer need to do • Or methods that once made sense but don’t any more due to newer technologies or changes in the organization or environment
Examples of Non-Value-Added, Not Essential Tasks • Excessive paperwork or approvals • Waits for test equipment or “signoff” • Debugging due to sloppy design or coding • Costs resulting from bugs in our software development tools • Costs for activities unrelated to the process These tasks should be eliminated or streamlined first, as they add cost for no useful purpose
Some Costs are Especially Painful • High costs incurred later because of tasks not performed during software development (or not performed at the right time or in the right way) • Debugging • Correcting defects • Maintenance and repair • These can subtract value: • Loss of customer good will • Future labor that must be expended
Typical Value-Added Categories Value-Added Non-Value-Added (costs $, no value to customer) 1) Customer Wants 2) Changes Product 3) Done Right the First Time Essential Non-Essential • Set-Up • Training • Planning • Customer-required test • Moving Data Between Steps • Many Quality Improvement activities • Extra paperwork • Waits • Delays • Bottlenecks • Counting • Installing Software Tools • Extra Un-wanted Features • Rework • Service • Modification • Expediting • Recall • Correction • Retest • Error Analysis • Design • Development • Fabrication • Documentation • Assembly • Process • Creation • Upgrade • Shipping
Value-Added Non-Essential Essential Non-Value-Added Analyzing Value-Added by Task or Category This is the first step of value-added analysis • List all of the tasks or task categories in your process • Then place each task into one or more of the three value-added classes • If a task fits more than one class, you may want to break it up into parts