Download
1 / 10
100 likes | 259 Vues
14 years of PSI Policy and its impact. Marc de Vries ( ePSI Platform) Madrid Conference Madrid 15 February 2012. Where do we come from?. Draft PSI Directive is a landmark Short overview of history and the patterns Impact PSI in total Sectors. Impact EU - Some highlights.

E N D
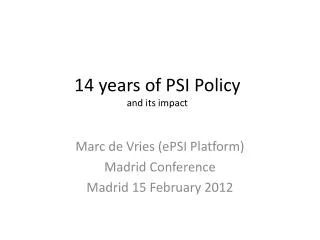
14 years of PSI Policyand its impact Marc de Vries (ePSI Platform) Madrid Conference Madrid 15 February 2012
Where do we come from? • Draft PSI Directive is a landmark • Short overview of history and the patterns • Impact • PSI in total • Sectors
Impact EU - Some highlights • 2006 – MEPSIR: 27 Billion euro (EU 27 + Norway) • 2008 – various studies: 28 Billion euro (EU 27) • 2011 – Vickery study (EU 27): • direct economic footprint 32 Billion euro (EU 27) • if marginal costs are implemented: 40 Billion • If indirect effects are included (innovation, social behaviour) • 2011 – POPSIS • Users and usage increase dramatically when marginal/zero costs • Cost recovery ratio own sales low (> 80% PSBs less than 5%) • Costs PSB go down if re-use is ‘professionalized’, even if usage goes up • Extra tax returns and efficiciency gains outweigh loss of income
Impact in sectors? • 2006 – MEPSIR: 27 Billion euro (EU 27 + Norway) • 2008 – various studies: 28 Billion euro (EU 27) • 2011 – Vickery study (EU 27): • direct economic footprint 32 Billion euro (EU 27) • if marginal costs are implemented: 40 Billion • If indirect effects are included (innovation, social behaviour) • 2011 – POPSIS • Users and usage increase dramatically when marginal/zero costs • Cost recovery ratio own sales low (> 80% PSBs less than 5%) • Costs PSB go down if re-use is ‘professionalized’, even if usage goes up • Extra tax returns and efficiciency gains outweigh loss of income
Impact in sectors? • What happened in PSI value chain? • Comparison 1998 – 2012 • Value chains of 3 sectors, you must guess… Create (produce, collect, compile) Collect, compile Distribute Re-use Public task domain Public task domain Outside public task Outside public task
Legal information value chain Produce Collect, compile Distribute Re-use 1998 1998: • Creating legislation is by definition public task • Traditionally only production was considered public task • Power was with distributors: owned compilation process and distribution platforms • Re-users: small and rich, no clustering of demand • High entry barriers, no substitutes WHAT HAPPENED? • Government took step forward, changed perception of public task • Pushed publishers forward in value chain, no charges Produce Collect, compile Distribute Re-use 2012
Traffic information/topographic information value chain Produce Collect, compile Distribute Re-use 1998 1998 • Public sector body monopolies, hardly private sector involvement WHAT HAPPENED? • Technology allows for non public sector parties to do sourcing • Up + down stream competition between public sector and market parties • Even internal public sector users switch to market parties products • public task charachter has become questionable • Only specific use within government justifies information to be PSI (defence, weather, public safety) Produce Collect, compile Distribute Re-use 2012 Produce
Meteo information value chain Produce Collect, compile Distribute Re-use 1998 1998 • High value data, mass consumption • Public task charachter case clear • Also, infrastructural investments and international set up disallow private sector to step in up stream market, so no upstream competition WHAT HAPPENED? • Division between NMI’s that have stepped out and those that stay in • Distinction between professional and mass markets (down stream) • Integrators has power over (other mass) distribution channels • Fierce competition in professional markets Produce Collect, compile Distribute Re-use professional M 2012 Re-useconsumer M
conclusions • There is no such thing as PSI • Impact Directive depends on shift power in value chain it will bring about and technology • Pockets of PSB market activities remain (meteo + cadastral information) • General rules of competition law remain to have role in other parts of value chain • Demarcation of public task is essential