Understanding the Tropospheric Ozone Budget in the South Atlantic Region
This study explores the tropospheric ozone (O3) budget in the South Atlantic region. Analyzing historical and seasonal data, the research identifies critical factors influencing O3 maxima, attributed to both anthropogenic and natural sources. Utilizing the GEOS-Chem model with satellite data constraints, the investigation reveals the significant roles of lightning emissions and biomass burning in shaping the ozone budget. Insights from this work are vital for understanding atmospheric dynamics and enhancing climate models.

Understanding the Tropospheric Ozone Budget in the South Atlantic Region
E N D
Presentation Transcript
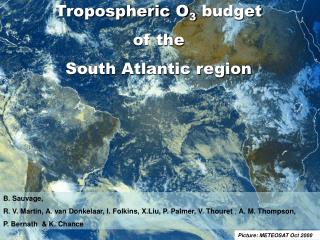
Tropospheric O3 budget of the South Atlantic region B. Sauvage, R. V. Martin, A. van Donkelaar, I. Folkins, X.Liu, P. Palmer, V. Thouret , A. M. Thompson, P. Bernath & K. Chance Picture: METEOSAT Oct 2000
Outstanding scientific issue in the Tropics Topic: O3 maximum zonal wave-one(from Fishman et al. 1987… to Wang et al 2006) GOME Seasonal Tropospheric O3 Columns 2000 DJF • Scientific interest: • year-round pattern observed since the 80’s. • Situated in MT-UT O3critical for radiative effect • Key role on the oxidizing power of the atmosphere • O3 maximumattributed to various anthropogenic and natural sources + dynamics MAM JJA Goal: What controls O3 maximum? (Sources / regions) SON DU data from Liu et al 2005
Methodology What controls the O3 maximum? 1 Global chemical transport model GEOS-Chem “Original” simulation High estimation emissionsuncertainty 2 Constraint & Evaluation In-situ & satellite observations Soils: a posteriori inventory of NOxfrom GOME (Jaeglé et al., 2005) Biomass burning: top-down constraint on NOx & VOCs from GOME Lightning: spatial distribution scaled to OTD-LIS Quantification (sources / regions) O3 maximum 3 Constrained “standard” simulation
Space-based constraint on emissions Tropospheric NO2 column ~ ENOx Tropospheric HCHO column ~ EVOC GOME: 320x40 km2 OTD-LIS Lightning flash rates hv O3 NO NO2 lifetime ~ month O3,HO2 NOx lifetime ~ week Free Troposphere HNO3 h PBL h NO2 HCHO CO NO OH hours hours O3 O3 VOC HNO3 lifetime ~ days Lifetime hours NOx VOC
Effect of satellite constraint in simulated tropospheric column O3 Large influence from lightning and biomass burning constraint ΔTropospheric O3 Columns “constrained” – “original ”simulations DJF MAM JJA SON ΔDU
Space-based constraint on lightning NOxemissions OTD-LIS flashes (1995-2004) local seasonal rescaling of lightning emissions Modeled lightning NOx emissions (DJF) Original constrained with OTD/LIS 109 molec N cm-2 s-1 -Regional differences / oceanic emissions -Same intensity: 5 Tg N yr-1
In-situ O3, data used to evaluate the simulation 1.MOZAIC airborne program (Marenco et al., 1998; Thouret et al. 1998): 1994-2004 landing and taking off phase 2.SHADOZ ozone sonde network (Thompson et al., 2003a; 2003b): 1998-2004 More than 9000 vertical profiles of O3 over the Tropics 30°N-30°S
Highlights of simulation evaluation: sensitivity to lightning constrained In-situ Rescaling improve middle-upper tropospheric O3 from 5-15 ppbv Main influence over subsident zone; South America; Middle East; East Sensitivity to lightning intensity: 7Tg N/yr too high; 3Tg N/yr too low; 5±2Tg N/yrgives overall agreement.
Space-based constraint on biomass burning emissions GOME NO2regional top-down constraint of biomass burning NOxemissions Tropics: 4.8TgN/yr 5.8TgN/yr GOME Model constrained Model original DJF MAM JJA SON data from Martin et al. 2002 1015 molec cm-2 Better agreement during biomass burning season Better spatial correlations between GOME and model NO2 columns R2 > 0.86
Space-based constraint on biomass burning emissions GOME HCHO top-down constraint of biomass burning VOCemissions HCHO and alkenes emissions increased x 2 GOME GEOS-Chem constrained GEOS-Chem original data from Chance et al. 2000 Better spatial correlations between GOME and model HCHO columns R2> 0.7 Better agreement during biomass burning season
Highlights of simulation evaluation: sensitivity to biomass burning Top-down improves lower tropospheric O3 from 5-20 ppbv during biomass burning season Main influence over Africa DJF-JJA; India MAM
What controls the O3 maximum? Use of constrained simulation Quantify (sources/regions) influencing O3 maximum O3 maximum ?
O3 budget / Sensitivity to sources Sensitivity to decreasing NOx emissions by 1% and 100% for each source >36% >7% >9% DJF MAM JJA SON ΔDU -Lightning downwind;largest influenceover the Tropics & South Atlantic -Surface sources local; half of the lightning NOx influence (but similar source strength) -Lightning Ozone Production Efficiency = 3 times OPE of each surface source -Tropical background 30%
O3 budget Sensitivity to regions Sensitivity to decreasing NOx emissions by 1% over regions >20% >15% >6% DJF MAM JJA SON ΔDU
The zonal-wave one Vertical-zonal seasonal cross section of O3 and O3 flux S. America DJF Africa MAM subsidence JJA SON
Dynamical description / annual mean Meridional transport SHADOZ+ MOZAIC S. Am. Africa NOx ppb 1/Surface emissions of O3 precursors 2/Injection of NOx into the MT-UT with lightning emissions and uplift into ITCZ 3/O3 buildup during transport and subsidence over South Atlantic high area 4/ Meridional transport ATLANTIC AFRICA S N O3 (ppbv) O3 (ppbv) Zonal transport Modeled O3 ppb
Conclusions 1/ Spatial distribution of lightning scaled to reproduce OTD-LIS seasonal mean Improve MT-UT O3 by 5 to 15 ppbv Lightning source of 5 Tg±2Tg best reproducesversusin-situ MOZAIC & SHADOZ 2/ Top-down constraint on emission inventories of NOx from soil and biomass burning, of VOCs from biomass burning improve LT O3 by 5 to 20 ppbv Surface NOx sources > 21% > 36% STE ~ 6% (500 Tg/yr) AFRICA >20% EAST South America >6% >15% O3 maximum is driven by convergence and sustained largely by lightning NOx emissions, which present larger OPE
Thanks for attention! Picture: METEOSAT Oct 2000
Comparison of convective schemes Flight altitude mean over Africa, 300-200hPa, JJA season CO RH ITCZ GEOS-3 presents weak convective outflow GEOS-4 low clouds altitude & optical thickness ITCZ O3 min/ CO max/ RH max Weak incidence over the Atlantic O3 ITCZ
CO & Relative humidity evaluation CO lower estimated in LT / CO; emissions increased by 2 weak or negative impact on modeled versus in-situ
Space-based constraint on emissions Seasonal NOx biomass burning emissions (DJF) Original Standard 109 molec N.cm-2.s-1 Different intensity of NOx emissions: Biomass burning: 4.8TgN/yr 5.8TgN/yr / Soils 3.5TgN/yr 4.5TgN/yr(Tropics). Larger influence over Africa and India.