Download

1 / 11
110 likes | 238 Vues
This study examines oscillations in EEG difference waves with a focus on various peak measures and mean amplitudes across age groups. We analyze data collected from five participants in different age ranges, emphasizing the peak amplitudes and latencies at specific time windows (100-250ms and 300-550ms). The variance of peak measures in the youngest group was notably higher, indicating distinct neural processing characteristics. The findings illustrate the visible oscillations in individual difference waves, with oscillation visibility varying by participant and session.

E N D
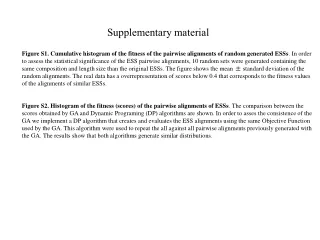
Supplementary materialBishop, Hardiman and Barry pp 2-10 Anovas: Mean amplitude, 100-250 ms Mean amplitude, 300-550 ms Peak Latency, 100-250 ms Peak Latency, 300-550 ms ITC, 0-300 ms ITC, 300-600 ms ERSP, 0-300 ms ERSP, 300-600 ms Peak amplitude, 100=250 ms, including dummy deviants p 11. Illustrative continuous files showing oscillations in difference waves
The ‘dummy’ deviant condition is included to demonstrate how, with peak measures, the youngest group has a larger peak when there is no mismatch. The variance is twice as large in this group than in other groups, though this is not clear from the SEs shown here, which are taken from SPSS marginal means [SPSS assumes equal variances and computes SE from sqrt(MSerror/N)].
Illustrative data to demonstrate visible oscillations in individual difference waves. Each line shows a portion of the continuous file spanning six epochs for one participant at electrode Fz. The participant number and age group are shown on the left: these are 5 participants from each age range who were picked at random. Epoch numbers are aligned with the stimulus onset, with the 200 ms basline marked by the prior vertical line. The extent to which oscillations are visible varies across the session and from participant to participant, in this sample, they are most apparent in participant 2.