Dust Definition Implementation
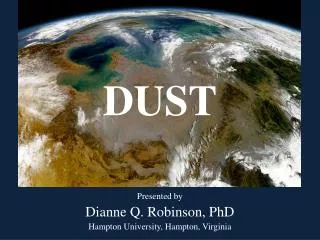
Dust Definition Implementation. Gerard Mansell, Julia Lester, Jason Conder ENVIRON International WRAP Carbon/Dust Conference May 24, 2006. Background: Dust Definition. Visibility standard references the “natural baseline”

Dust Definition Implementation
E N D
Presentation Transcript
Dust Definition Implementation Gerard Mansell, Julia Lester, Jason Conder ENVIRON International WRAP Carbon/Dust Conference May 24, 2006
Background: Dust Definition • Visibility standard references the “natural baseline” • How do you identify/quantify natural and anthropogenic dust sources/emissions? What mitigations are possible? • DEJF developed draft dust definition
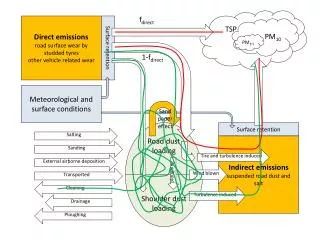
Category 2 Category 3 Category 1 Emissions due to anthropogenic influence Total Dust Emissions Emissions under healthy, natural conditions Mixed: Land impacted by native and non-native animals, dry lake shores / beds Pure Natural: Erupting volcanoes, sea spray, etc. Pure Anthro: construction, agriculture, roadways, etc. Feasibility Assessment Approach • Feasibility Report • related approaches, data/methodology resource assessment, Feasibility Assessment Protocol • Established 3 categories
Partitioning of Category 3 Sources • Category 3 Partitioning, “Direct-Comparison” Approach • Compare Category 3 dust emissions at sites with actual or created “natural” reference sites (on site/source basis) • Reference areas, reference time periods • Ecosystem health as opposed to disturbance ranges • Modeling • Data information resources (Report, Appendix A) • Web location, cost, “owner,” description, spatial extent (location), user interface, user input, data format, spatial resolution, data export, user requirements, information need check-off, WRAP dust definition applicability score, and notes
Feasibility Assessment Protocol • Identify the purpose and goals of the analysis • Conceptual Model and initial source rank order • Identify major Category 3 sources • Identify controls/mitigations, if desired • For major Category 3 sources, are existing methods/databases available to characterize, estimate, and/or partition the emissions? • If not, can the necessary methods/databases be developed and at what cost? • If the answers to 5 and/or 6 are yes, definition can be implemented
Case Studies • Several potential case studies identified • 2 case studies identified through discussion with WRAP staff and the DEJF: • Saguaro West (SAWE) in Pima County Arizona • CoD / CoHA: 123 dust days of soil / coarse mass major contributors to 20% worst visibility days • Salt Creek Wilderness in New Mexico • CoD / CoHA • DRI CoD Backward Trajectory Analysis • Near Emissions Inventory • Interaction with the New Mexico SIP PilotProject
CM Geographic, geological, topographical, ecological, climatological and land use setting PM and Visibility setting Step 2: Conceptual Model WRAP Products/Tools: AoH, CoHA, CoD, In and Near Class 1 Areas, Near Emission Inventories State/Local Information Initial source ranking Major Category 3 Sources
Step 2 (cont): Initial Ranking of Sources • Saguaro West • Most significant: Windblown from shrub land (Cat. 3) • Major: Other windblown (Cat. 3), agriculture (Cat. 1) • Unknown: Emissions and/or the natural “disturbance” due to burrowing animals • Salt Creek Wilderness • Most significant: Windblown from shrub/grass lands (Cat. 3) • Major: Other windblown (Cat 3.); agriculture, construction, road dust (Cat. 1) • Other: Emissions and/or the natural “disturbance” due to burrowing animals
Step 3: Major Category 3 Sources • Saguaro West: Windblown (shrubland) • Salt Creek (with current inventory) • Windblown (shrubland & grasslands) • Others: to be determined
Step 4: Mitigations / Control • Identify possible mitigations and controls that may be applied to Category 1 and specific Category 3 sources • Impact of controls/mitigations on Category 3 sources related to emission partitioning • Saguaro West – Not part of case study • Salt Creek Wilderness • Controls/ mitigations identified through the NM SIP Pilot Project
Step 5: Resource Availability for Category 3 Sources • For major Category 3 contributors, are resources available to characterize, estimate, and/or partition the emissions? • Data and Model Resource Identification • Dust source characterization • Site-specific dust emission estimates • Emission partitioning
Step 5: Emission Estimates • Saguaro: Rough, based on 12x12km estimates from windblown dust model • Salt Creek Wilderness: Refined inventory, based on WRAP modeling data, revised spatial allocation, local data, Causes of Haze (CoH) analyses (DRI), etc.
Step 5: Emission Estimates WRAP modeling PM10 dust emission inventory data (includes TFs); spatially allocated to 100-km analysis area; reflects spatial allocation based on 1992 NLCD
Step 5: Emission Estimates WRAP county-level PM10 dust emission inventory data (tpy)
Refined Emission Estimates • Refine emission estimates through spatial allocation using updated LULC data • Incorporate local available data • Work is on-going • Utilize CoH analysis from DRI
PM10 Dust emissions allocated to 100-km analysis area using 2000 NALC-based surrogates • Spatial allocation to 100-km analysis area
Consider dust emission source areas based on back-trajectories for SACR • DRI Back-trajectory Analysis
Step 5: Category 3 Partitioning • Saguaro West: Information available to generally identify impacted areas (e.g. unpaved road and grazing areas) and to identify a “natural” reference area, but no current analysis performed • Salt Creek Wilderness: • Results pending
Dust Emissions from Burrowing Animals • Excavate as much as 5,100 tons soil/mi2•year • If fully entrained, may generate as much as 6 metric tons PM10 /mi2•year (Saguaro West) • Burrowing activity affects vegetation cover at landscape scales • In certain areas, there may be no additional emissions even if anthropogenic disturbances are present Botta’s pocket gopher Thomomys bottae
CONCLUSIONS • Dust definition implementation feasible • No “one-size-fits all” approach • Wide variety of information resources available • Key challenges • Reconciling different emission estimates • Partitioning Category 3 sources • Identifying reference areas / time periods • Quantifying impact of natural disturbances • Assessment Report and draft Saguaro Study available • Provides a process (and a tool – Conceptual Model) for integrating WRAP tools/projects during SIP development – NM SIP Pilot Project • Feedback to emissions models