Applications of On-chip Trace on Debugging Embedded Processor
170 likes | 327 Vues
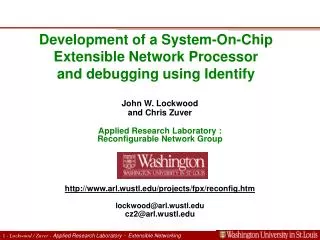
Applications of On-chip Trace on Debugging Embedded Processor. Xiao Hu and Shuming Chen Geum-Seo Koo 2009. 1. 13.(Tue.) GNU OS Lab. Introduction#1. Debug Techniques Software simulator A debug tool with low cost Make modeling real systems imprecisely Breakoints and single stepping

Applications of On-chip Trace on Debugging Embedded Processor
E N D
Presentation Transcript
Applications of On-chip Trace on Debugging Embedded Processor Xiao Hu and Shuming Chen Geum-Seo Koo 2009. 1. 13.(Tue.) GNU OS Lab.
Introduction#1 • Debug Techniques • Software simulator • A debug tool with low cost • Make modeling real systems imprecisely • Breakoints and single stepping • Change software behavior in the real-time systems • Hard to be watched using traditional debug techniques • Logic analyzers • Do not change software behavior • Now buried in silicon
Introduction#2 • Software instruments and profiling • Intrusive and comsumes excessive system resources • S/W behavior in real-time may be changed by the instructions added • On-chip trace technique • Non-intrusively record real-time information • The key issues: what information should be recored, how to compress, transfer and store trace daa, how to apply trace information
Debug Techniques Debug: Get processor Behavior Simulation Emulation Real Chip Out Chip Login Analyzer On Chip Profiller/monitor Software modified On-chip hardware No Software modified Break Point/ Single Step Intrusive Trace Non-intrusive Relatioinships of debug techniques
YHFP-QDSP • Heterogeneous multiprocessor SoC integrated a commercial RISC core and four DSP cores • The development tools • Include On-chip debug hardware • Emulators with I/O ports of the enhanced JTAG or the host processor interface • Software simulators • IDE with graphic interfaces TraceDo
TraceDo System • TraceDo • Trace for Debug and Optimization • Modular and scalable YHFT-QDSP RISC core Trace Module DSC core DRAM Trace Module Trace Analyzer DSP core Emulator Trace Port Time Stamp IDE Trace Module DSP core 24bits counter Debug Host PC Trace Module DSP core Structure of TraceDo.
Functions and Advantages • On-chip trace H/W • Records program path(path trace) • Data access(data trace) • Peripheral events(event trace) • Compress • Emulator • Receive trace message • Attaches out-chip timestamps • Trace analyzer • Decompresses and analyzes trace messages
The Message Format of TeaceDo • Various lengths aligned on byte boundaries • Compresses values of address and data in the XOR scheme • Avoiding transferring the redundancy high bytes • LS encoder • Compressing results of conditional direct branches by bit mapping and length encoding Header: message type F(Follow bit)=1: no following byte Data Sect: message data Message structure of TraceDo
Path Trace • A process of information transfer with compression and decompression • Object codes • Process input data in th real chip and determine the program execution path • On-chip trace H/W • Records such path and compresses(trace messages) • Program execution path • Compressed by removing redundant hardware archtectures information and redundant p/g information
Program Flow Discontinities inYHFT-DSP * The program flow discontinuities are caused by branches and interrupts
Trace Application • The main applications of on-chip trace • Path-based optimization • Instruction memory optimization • Debug • Testing • Software complexity criteria and program understanding • Data trace
Debug using TraceDo • The migration of an image recognitions program to YHFT-QDSP • When usging Bp & ss -> Give the whole hierarchy execution path and the execution time of each function • When multicores work thgether -> Run-time execution informations of muticores are acquired without terminating the system running • When instructions insert -> much avoided by usging TraceDo
Optimization using TraceDo • An application example of the JPEG encoder running in on DSP core is used for optimization A section of program execution path
Ratios of Execution Time PStall: pipeline stall for fetching instruction DStall: pipeline stall for fetching data Replaced by DMA operations Optimized by code layout for avoiding instruction cache conflicts data layout: reducing data cache conflict miss (Optimized in assemble language The total execution time of the JPEG application is reduced by 7.2%
Conclusion • The non-intrusive debug of embedded software is a hard problem • On-chip trace • Non-intrusive debug technieuq without software modificatoin • Suitable for debug and optimization • Applications: debug, testing, codes optimization and program understanding etc.