Download
1 / 1
10 likes | 172 Vues
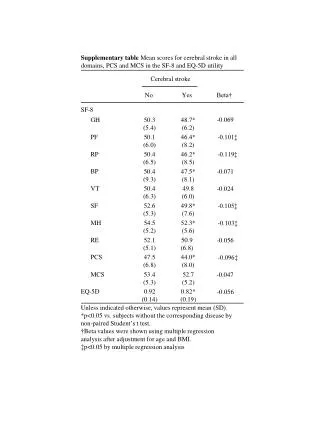
Supplementary table Mean scores for cerebral stroke in all domains, PCS and MCS in the SF-8 and EQ-5D utility. Cerebral stroke. No. Yes. Beta†. SF-8. GH. 50.3 (5.4). 48.7* (6.2). PF. 50.1 (6.0). 46.4* (8.2). -0.069. RP. 50.4 (6.5). 46.2* (8.5). -0.101‡. BP. 50.4 (9.3).

E N D
Supplementary table Mean scores for cerebral stroke in all domains, PCS and MCS in the SF-8 and EQ-5D utility Cerebral stroke No Yes Beta† SF-8 GH 50.3 (5.4) 48.7* (6.2) PF 50.1 (6.0) 46.4* (8.2) -0.069 RP 50.4 (6.5) 46.2* (8.5) -0.101‡ BP 50.4 (9.3) 47.5* (8.1) -0.119‡ VT 50.4 (6.3) 49.8 (6.0) -0.071 -0.024 SF 52.6 (5.3) 49.8* (7.6) -0.105‡ MH 54.5 (5.2) 52.3* (5.6) -0.103‡ RE 52.1 (5.1) 50.9 (6.8) -0.056 PCS 47.5 (6.8) 44.0* (8.0) -0.096‡ MCS 53.4 (5.3) 52.7 (5.2) -0.047 -0.056 EQ-5D 0.92 (0.14) 0.82* (0.19) Unless indicated otherwise, values represent mean (SD). *p<0.05 vs. subjects without the corresponding disease by non-paired Student’s t test. †Beta values were shown using multiple regression analysis after adjustment for age and BMI. ‡p<0.05 by multiple regression analysis