Download
1 / 21
210 likes | 353 Vues
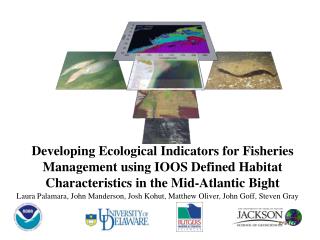
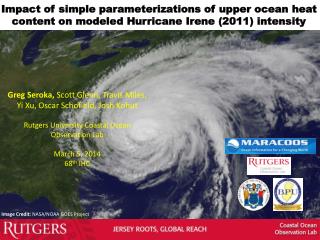
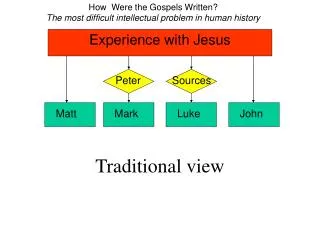
Mapping and Using Dynamic Ocean Biogeographic Provinces. Matt Oliver Andrew Irwin Oscar Schofield Josh Kohut John Manderson Matt Grossi. Questions. Can we make objective, dynamic provinces? Do province boundaries reflect hydrography? Do changes in province size reflect real processes?

E N D
Mapping and Using Dynamic Ocean Biogeographic Provinces Matt Oliver Andrew Irwin Oscar Schofield Josh Kohut John Manderson Matt Grossi
Questions • Can we make objective, dynamic provinces? • Do province boundaries reflect hydrography? • Do changes in province size reflect real processes? • How can we use provinces for comparative analysis?
Objective unsupervised classification Oliver et al (2004) JGR Oceans SeaWiFSAVHRR SST MODIS/Aqua
Monthly time-series (1998-2007) Maps are easy to make for your own application – see data.mmab.ca Also will be available via http://oceancolor.gsfc.nasa.gov/ soon
ENSO Time Series Blue & green provinces with triangles
ENSO indexes Oliver & Irwin (2008) GRL Province areas (sum of 3) 2003 Jan 2006 Dec
Oligotrophic province area SeaWiFS/AVHRR 2007 Annual
Area of the most oligotrophic province is mostly increasing over time.Combined Desert Areas are Oscillating SeaWiFS & MODIS/Aqua Oliver & Irwin (2009) GRL
PDO & Oligotrophic Province area The total area of the oligotrophic provinces oscillate together with the PDO.
Flavobacteria communities reflect provinces (Sept 2006) Gómez-Pereira et al. 2010, The ISME Journal
Applying Dynamic Biomes to Fisheries Abundance of Longfin squid and Butterfish related to province gradients If Quicktime animation doesn’t automatically open, click this link: play movie
Merging Argo Profiles and Biomes Searching for vertical structure ARGO DATA ASSESSMENT USING QUALITY CONTROL (QC) FLAGS No. of profiles Remaining Downloaded 500253 Missing variables 2000 498253 Failed QC 82962 415291 Profile <10 m 920 414371 Total analyzed: 414371
Modified Holling III Curve All Models are wrong, some are useful – G. Box A=0.08 B=143 C=1027 D=0.005 E=15.7 E A=4.1 B=147 C=1022 D=0.005 E=11.3 D A=7.3 B=137 C=1021 D=0.004 E=1.04 C
Argo Analysis for desert biome Errors of Profiles
3-D density predictions at 4km resolution 2000m Variability > 0.25 kg/m^3
3-D density predictions at 4km resolution 500m Variability > 0.25 kg/m^3
3-D density predictions at 4km resolution 100m Variability > 0.25 kg/m^3
Conclusions • Dynamic Provinces reflect hydrography • Dynamic Provinces reflect ENSO and PDO • Provinces reflect Flavobacterial Communities • Province Boundaries are useful for fisheries • Provinces are useful for 3-D predictions of ocean density (moving from biomes to physics)