
Analyzing Climatic Controls on Tree-Ring Formation Using Ground-Based Datasets
As ground-based datasets accumulate, our project aims to analyze the climatic controls of tree-ring formation across various study regions. We will utilize a forward process-based model to link climate data with tree growth, guided by tree-ring data insights. Additionally, a data-mining approach will explore the relationship between climate, tree rings, and NDVI observations. Our preliminary report includes findings from the 2009 field campaign and outlines future plans. We observe significant associations between ring widths and summer temperatures, particularly for spruce and pine.

Analyzing Climatic Controls on Tree-Ring Formation Using Ground-Based Datasets
E N D
Presentation Transcript
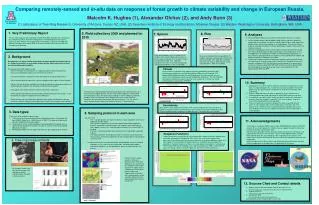
9. Analyses As the ground-based datasets accumulate we will conduct analyses as follows: • Using a forward, process-based model linking climate, and forest growth as captured by tree-ring data, the process-based model will be used to explore the climatic control of tree-ring formation in all study regions. The results of these analyses will guide the choice of climatic explanatory variables to be used in the statistical analyses. • A data-mining approach will be used to explore relationships between climate, tree-rings and Pg derived from NDVI observations in all combinations. These two approaches to modeling tree growth are complementary approaches as they minimize typical parametric assumptions of tree growth/climate models and emphasize process and pattern in the data. • Comparison of observed and simulated tree-ring data, and Pg from NDVI with measured results at the flux tower at the Central Forest Biosphere Reserve. A record is available of CO2 flux (Net Ecosystem Exchange) at a spruce forest site there. From these data NEP, GPP, NPP of the forest can be derived.NEP will be compared to tree-ring data, and remote sensing products will be compared with GPP and NPP. 1. Very Preliminary Report 8. Pine 7. Spruce The first field campaign was completed in September 2009. Subsequently staff training was completed, and the time consuming process of developing the primary data is under way. Here we give some background on the project, a report on the 2009 field collection and plans for summer 2010, and some illustration of the nature of the tree-ring data being collected. ++ 5. Field collections 2009 and planned for 2010 Mean and standard error of ring width for 30 samples from spruce in boreal forest close to the flux tower at location #1 (see box 5). Oldest tree goes back to AD 1714, replication strongest since late 19th century. Note typically strong autocorrelation (~0.77) in ring widths. Mean and standard error of ring width for 25 samples from pine in boreal forest. Oldest tree goes back to AD 1787, replication strongest since late 19th century. Note typically strong autocorrelation (~0.95) in ring widths. 2. Background • Our objective is to place satellite observations of forest growth in European Russia in a longer-term context, so as to better understand the nature and causes of inter-annual to multidecadal variability. • The key questions to be addressed are: • Are the remotely-sensed measures of vegetation growth and tree-ring derived measures of vegetation growth consistent with one another? • Can their similarities and inconsistencies be explained on a quantitative basis? • To what extent do they capture the same or complementary aspects of forest growth? • What is the role of climate variability in causing the individual and common patterns of spatiotemporal variability in the remotely-sensed and tree-ring data? • How typical have the past 30 years been of the previous 100 years? • Have relationships between climate and forest growth changed in recent years, or are they within the range of variability of the last 100 years? • To what extent can the relationships between forest growth and climate as derived from these datasets help constrain expectations of near future change in forest growth? Climate 3 . An overview of associations with regional climate is provided by correlations with monthly mean temperature and total precipitation at Moscow for the period 1891 through 2008 (Global Historical Climate Network data1) A small fraction of missing values were interpolated using these and neighboring station data. The tree-ring width data were converted to residuals from time series models fit to remove the strong autocorrelation using program ARSTAN2. 10. Summary precipitation • Good progress has been made in collecting and processing primary tree-ring data in a region (European Russia) with few such data available. The earliest growth rings for spruce and pine at location #1 were AD 1712 and AD 1787, respectively. • Summer 2009 field work also gave an opportunity to test and refine the sampling protocol designed specifically for linking NDVI and tree-ring data. • As expected, ring-widths in both spruce and pine at location #1 show robust common signal (co-variation), especially in the case of spruce. They also show strong autocorrelation, also expected. • There are significant associations between the mean ring-width derived series for each species and summer temperatures in the prior year. The species at this site differ in the association between ring width and current year conditions. There was no evidence for change in these relationships in recent decades. temperature Significant at 95% 1 2 Year of growth Year prior to growth 6. Sampling protocol in each area • Our aim is that. • The 7 sample locations are representative of a major component of the forest vegetation of their region. • Each specific sampling site should correspond to identifiable vegetation features at kilometer scale observed in the remotely-sensed indicators of forest growth, which in turn should be representative of the relevant NDVI 8-km pixel. • The trees sampled should be representative of those identifiable vegetation features. • The sample locations should be accessible, in that they can be reached at minimum cost, and with the agreement of those responsible for regulating the use of the land. • In order to achieve this, we meet with locally knowledgeable scientists and land managers on site, and using their information, and geospatial products prepared in advance (see example below) , precise sample locations are chosen. Increment cores are being taken from pine and spruce trees (where present) in 7 areas across European Russia. The four areas to be sampled in summer 2010 are indicated by name. The three areas sampled in summer 2009 are shown by numbers, thus 1) the Central Forest Biosphere Reserve, 2) the Oka River Biosphere Reserve and 3) the Karelian Biosphere Reserve. 173, 131 and 111 cores respectively were taken from the three reserves, 2 from each tree. Correlations Both species show significant correlations with summer temperatures of the year prior to growth. They differ in Spruce correlating with January and current August temperature and Pine having precipitation correlations of opposing signs in Spring of the year of growth. 4. Tree-ring measurements 11. Acknowledgements 3. Data types • This project is funded by NASA award number NNX09AK58G through the NEESPI element of the LCLUC program. A. Olchev receives support through the Severtsov Institute of Ecology and Evolution, RAS. • We extend our gratitude to Elena Novenko, Katya Kuznetsova, Chris Baisan, and Logan Berner who were essential to the success of the 2009 field work, and they were aided by other Russian colleagues. We are grateful to the scientists and administrators of the three Biosphere Reserves where we sampled for their help and cooperation. • Mark Losleben and Jim Burns processed, dated and measured the tree-ring data. • Mark Losleben gave invaluable help in the production of this poster. • Three main kinds of data are being used: • Estimates of forest growth derived from satellite observations, for example Pg from AVHRR (Goetz et al., 2005; Bunn et al. 2007). This dataset will be almost 30 years long by the end of our project; • A new network of tree-ring chronologies to be developed for European Russia, specifically designed for this project,. Virtually all, if not all, of these data will be 100 years or longer; • Meteorological data from the region (40-150 years data, depending on location). Response Functions In order to deal with multicollinearity in the climate data, response functions (above) were calculated using program Dendroclim 20023, which uses a form of orthogonalized regression. These give a more conservative view of the associations between climate and tree-ring data. The coefficients may be thought of as analogous to partial regression coefficients. Evolutive response functions are shown below, calculated first for the period 1892 through 1959 and then adding a year and recalculating until 2008 is reached. This shows no striking change in climate response in these trees in the satellite era. All variables shown to the right are being measured and density profiles stored, but only ring width is discussed here. • At each chosen sample location ~30 mature dominant trees from more open parts of a stand are to be sampled for pine and/or spruce. This type of tree is sampled so as to minimize growth surges and suppressions associated with stand dynamics, and to avoid the rapid and erratic radial growth often found in young trees. 12. Sources Cited and Contact details • Global Historical Climate Network Data for Moscow, Russia: http://climexp.knmi.nl/selectstation.cgi?someone@somewhere • Program ARSTAN: • http://www.ltrr.arizona.edu/pub/dpl/ • DendroClim 2002 • http://dendrolab.org/dendroclim2002.htm • Corresponding author: mhughes@ltrr.arizona.edu Comparing remotely-sensed and in-situ data on response of forest growth to climate variability and change in European Russia. Malcolm K. Hughes (1), Alexander Olchev (2), and Andy Bunn (3) (1) Laboratory of Tree-Ring Research, University of Arizona, Tucson AZ, USA, (2) Severtsov Institute of Ecology and Evolution, Moscow, Russia, (3) Western Washington University, Bellingham, WA, USA Sampling protocol in each area • Our aim is that. • The 7 sample locations are representative of a major component of the forest vegetation of their region. • Each specific sampling site should correspond to identifiable vegetation features at kilometer scale observed in the remotely-sensed indicators of forest growth, which in turn should be representative of the relevant NDVI 8-km pixel. • The trees sampled should be representative of those identifiable vegetation features. • The sample locations should be accessible, in that they can be reached at minimum cost, and with the agreement of those responsible for regulating the use of the land. • In order to achieve this, we meet with locally knowledgeable scientists and land managers on site, and using their information, and geospatial products prepared in advance (see example below) , precise sample locations are chosen.