Download
1 / 37
370 likes | 390 Vues
Explore the economic evolution of Sweden from the 1980s to the 2000s, focusing on demographics, institutions, labor, and consumption profiles. This period saw significant changes in the country's economic landscape, including growth patterns, EU integration, and societal welfare systems.

E N D
Economic life cycle in Sweden: 1980s, 1990s, & 2000s Daniel HallbergInstitute for Futures Studies, Stockholm • 1 Demographic background • 2 Institutional background • 3 Labor and consumption profiles over life and changes 1985-2003
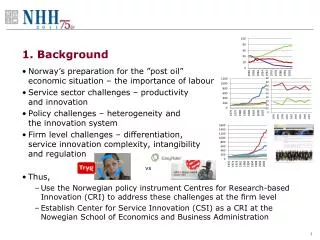
Sweden is a country with a large public sector • High taxes but also built out social security and free of expense health care; child care, schools, universities etc. • Economic growth about 2-3 percent during the last 15 years • Is a small open economy heavily dependent on exports and imports • Joined the EU in 1995 • Has not joinded the Euro
Sweden has a large public sector • High taxes but also built out social security and free health care, child care etc. • Economic growth about 2-3 XXX percent during the last 15 years • Is a small open economy havily dependent on exports and imports • Joined the EU in …XX • Have not joinded the Euro Economic growth
Sweden has a large public sector • High taxes but also built out social security and free of expense health care, child care schools, universities etc. • Economic growth about 2-3 percent during the last 15 years • Is a small open economy heavily dependent on exports and imports • Joined the EU in 1995 • Has not joinded the Euro Exports as share of GDP Imports as share of GDP
Income development (averages) All Women Men Source: Johansson (2006)
Economic equality (Gini) All Women Men Source: Johansson (2006)
b) Age composition Large swings in birth cohorts… create large swings in the labor force 1940-boomers 1960-boomers Baby-boom 1986-93 2005
b) Age composition Large swings in birth cohorts…create large swings in the labor force 1940-boomers 1960-boomers Baby-boom 1986-93 2005 2015
c) Education, family formation, and entry into the labor market are delayed University diplomas by age Kvinnor Women Aged 25 or older Aged 24 or younger Aged 25 or older Aged 24 or younger Men Män Aged 25 or older Aged 24 or younger Source: SCB
Delayed childbearing Age of mother at birth Source: SCB
Delayed childbearing 24 Age of mother at birth Source: SCB
Delayed childbearing 24 32 Age of mother at birth Source: SCB
Swedish women combine work and small children Source: Labour force surveys
2 Swedish institutional backgrounda) Benefits • Comprehensive social income insurance • Sickness • Unemployment • Parental leave • Nominal fee health care provisions • Free education at all levels (incl subsidised student loans for consumption expenses) • Notional defined contribution pensions
b) Swedish institutional backgroundTaxes • Local income taxes around 30 percent • State income taxes 20-25 percent above ceiling • Ceiling around $50 000 • Payroll taxes and fees 40-50 percent on top of gross income • Capital income tax flat rate 30 percent • Wealth and real estate taxes around 2 percent • Value added taxes 6, 12 and 25 percent
c) Subsidy systems 1Education • Entitlement daycare/pre-school (1-12) low fee high subsidies, 80% of pre-school children, • Compulsory school (7-16) Pre-school 6 years added. Public financing (even if private operation) • Upper secondary school (3-4 years) >90% enrolment. • Tertiary education free (but rationed) 50% enrollment (also vocational education)
Subsidy systems 2 Transfers • Universal child allowance 100 EUR a month up to 16-19 years. • Parental leave insurance (80% or more regular income) 390 days (another 3 months at low flat rate) flexible uptake • Until child 12 years parents can stay home for care of sick child at the same replacement rate • Means tested housing allowance mainly supports single parents. • Students get an extra allowance if they have children. • One of the parents, generally the mother also gets extra pension rights for each child.
Labor earnings, and other income data, taxes, transfers, etc. * Income data from LINDA 1968-2006 Public consumption * Generational analysis data base Ministry of finance 1930-1997 real data 1998-2110 simulated data (SESIM) * For 2000-03 we rely on a broad array of official data sources from Statistics Sweden Private consumption Household expenditure surveys (HUT) 1978 1985 1988 1992 1995 1996 1999 2000 2001 2003 2004 2005 3 Labor and consumption profilesa) Data
Labor earnings, and other income data, taxes, transfers, etc. * Income data from LINDA 1968-2006 Public consumption * Generational analysis data base Ministry of finance 1930-1997 real data 1998-2110 simulated data (SESIM) * For 2000-03 we rely on a broad array of official data sources from Statistics Sweden Private consumption Household expenditure surveys (HUT) 1978 1985 1988 1992 1995 1996 1999 2000 2001 2003 2004 2005 Years with both labor earnings and consumption 1985 1988 1992 1995 1996 2000 2001 2003 3 Labor and consumption profilesa) Data
Generational analysis (GA) data & LINDA • LINDA is a 3% random sample of the population, about 300,000 per year • Income and tax registers, public transfers, taxes, imputed payroll fees. • The GA data set is a 19% random sample of the LINDA data base, corresponding to about 58,000 observations per year. • Gender, age and year specific estimates of public consumption on education, health, elderly care, etc. • The GA follows individuals, and their households, back to the 1930s, but here we present data from 1985-97
Private consumption from Household expenditure surveys (HUT) • Household expenditure surveys (HUT) are avalible for 12 years • 1978 1985 1988 1992 1995 1996 1999 2000 2001 2003 2004 2005 • Covers sample persons aged 0-79 & their hh members • Sample sizes and non-response rates vary, e.g. in 2003, random sample of 4000 in ages 0-79, with 42% non-response • To some extent sample weights compensate for this
Labor earnings Scaled by YL ages 30-49
Public and private consumption Public Private
b) Life Cycle Deficit Scaled by YL ages 30-49
Comparison per capita profiles of labor income and consumption, 1985 and 2003
Delayed production and consumption: Trends in average age of production (labor income) and consumption, weighted by population
Age composition is partly the answer: Life cycle deficit weighted by population current year
4 Conclusions • In an international comparison, Sweden has a built out public sector with high public expences for the eldely and for the young • There is also high LFP among women, one effect of public child care at eary ages • Changes in production and consumption towards - on average- higher ages between 1980s and 2000s • Mainly increased public consumption at higher ages • Some reflect increased age of retirement • However the main impression is that per capita profiles seem very stable • Data is still preliminary, and the time span presented here is rather short • The major data limitation is for private consumption/expenditure • Both in terms of the time period covered and in data quality