
CD4 Haplotype Linkage Disequilibrium Analysis in Guinea Bissau
Explore CD4 haplotype linkage disequilibrium in Guinea Bissau between HIV-2 case and control groups. LD plots for D’ and r2 values, haplotype blocks analysis using HaploView program.

CD4 Haplotype Linkage Disequilibrium Analysis in Guinea Bissau
E N D
Presentation Transcript
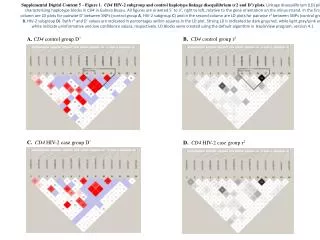
A. CD4 control group D’ B. CD4 control group r2 Supplemental Digital Content 5 - Figure 1. CD4 HIV-2 subgroup and control haplotype linkage disequilibrium (r2 and D’) plots. Linkage disequilibrium (LD) plots characterizing haplotype blocks in CD4 in Guinea Bissau. All figures are oriented 5’ to 3’, right to left, relative to the gene orientation on the minus strand. In the first column are LD plots for pairwise D’ between SNPs (control group A, HIV-2 subgroup C) and in the second column are LD plots for pairwise r2 between SNPs (control group B, HIV-2 subgroup D). Both r2 and D’ values are indicated in percentages within squares in the LD plot. Strong LD is indicated by dark gray/red, while light gray/pink and white indicate uninformative and low confidence values, respectively. LD Blocks were created using the default algorithm in HaploView program, version 4.1. C. CD4 HIV-2 case group D’ D. CD4 HIV-2 case group r2