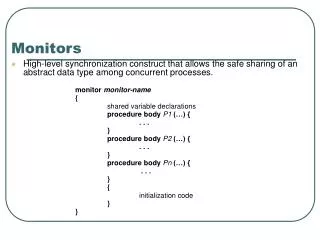
FNAL Intensity Monitors Summary
340 likes | 354 Vues
This summary provides information on the FNAL DCCT and RR DCCT intensity monitors, including their specifications, construction, and calibration procedure.

FNAL Intensity Monitors Summary
E N D
Presentation Transcript
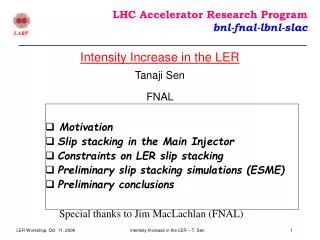
FNAL Intensity Monitors Summary M. A. Ibrahim US-Japan Mini Workshop 9-11 November 2016
Main Injector (MI) DCCT • 2 sets of current transformers • two 5.5” ID, 7” OD, 2”High, 2mil supermalloy (nickel-iron alloy) tape wound cores, with a minimum permeability of 45000 and driven at 200Hz modulation frequency • set of 4 tape-wound cores similar in construction to the wall current monitor sensors • Cables consist of 4 Heliax cables and 3 Trumpeter TWC2-78 • The detector housing is typically a steel shell. Inside, magnetic shielding is provided with three cylindrical metal layers. The layers are comprised of material, such as hipernorm, HYM-80, and 4.79 moly-permalloy, which all are highly permeable once annealed. The layers are separated with insulating 3/16”automotive felt. • Ceramic break is commercial 6.0” ID isolator made of alumina ceramic with 52 Nickel iron weldable lips. • Harmonics of the rotation frequency of the beam are suppressed with a resistor-capacitor network across the ceramic break. (35 parallel pairs of 100Ω in series with 390pF).
Recycler (RR) DCCT (Installed in 2007) • Bergoz NPCT-113-C100-HR : 113mm ID, high resolution with modulation frequency of 31.5kHz and set to a full-scale range : +/-2A • Signal cable is 100m, non-halogen, low-smoke, flame retardant polypropylene cable. (IEC 544-4 Radiation index estimate 5.5-5.9) • From datasheet, sensor is expected to have 5 μA/K temperature drift. Measured 9.64uA change /degC during RR bake as part of installation. • A copper housing enclosed the sensor and a ceramic insulator. • A cylindrical sleeve was constructed of 2 layers of 80% nickel-iron-molybdenum alloy with an initial relative magnetic permeability >25000. The alloy was annealed after all machining and forming. Inner support pieces made of G-10 Fiberglass Epoxy maintain a 5/8” air gap between the 2 layer. Closing the ends of a cylindrical shield with shielding disks, or flanges, adds very little to the shielding factor. • Ceramic break is commercial 4.0” ID isolator made of alumina-ceramic with nickel-iron weldable lips. • Harmonics of the 89811 Hz rotation frequency of the beam are suppressed with a 88uF capacitive network across the ceramic break.
DCCTs in Development Three 6.5” ID, 8.5” OD, 1”High, 0.007” tape wound nanocrystalline cores, held in place with expanding stainless steel clamps and G10 shoes. Two cores are driven in opposite polarity at 2KHz or 200Hz. Cables consist of 4 Heliax cables and 3 Trumpeter TWC2-78 The detector housing is typically a steel shell. Inside, a cylindrical sleeve was constructed of 2 layers of mu-metal, separated with 0.375” air gap maintained with peek spacers and G-10 brackets. Ceramic break is commercial 4.0” ID isolator made of 0.157” wide ceramic with stainless steel weldable lips. No network is used across the ceramic break.
Control System Interface The MI and Bergoz DCCT outputs are buffered, filtered to 500Hz , and converted to a+/-5Vdifferential signal. The buffer amplifier output is processed by commercial VME ADC (ICS-110BL-8B). It provides 4 differential 24 bit sigma-delta ADC channels. The ADC samples at 2880Hz the DCCT output and averages the intensity at a 720Hz data rate. It has a measured 18.5 effective number of bits, providing a dynamic range of 110dB. The DCCTs being developed are entirely instrumented with a VME digitzer card with 250MHz ADCs and DACs. These system directly report the beam intensity to registers readable over the VME backplane. Both ADC cards are housed in a VME five-slot crate with a Motorola MVME controller. This controller normalizes the reported intensity with the RF frequency, corrects for baseline drifts, and averages the intensity at a 720Hz data rate.
DCCT Calibration Procedure • The intensity measurements are recorded and compared against expected intensities at given calibration currents. • Initially, a calibrations were done with a DC voltage source and burden resistor. Variations in the voltage drop across the resistance were measured as well as DCCT readouts. Impedance of calibration winding is measured to <0.1%. • In 2005, Keithley 2400 DC Current Source was purchased and dedicated for calibrations. With it, calibrations covered the full-dynamic range of the system and provided current drive up to ± 1A with 10pA minimum resolution and readout to 0.029% + 300pA accuracy • Regressions between the data sets should follow a linear model. A least-squares fit is performed between the data sets to find a simple "trend line", which minimizes the sum of the absolute values of the vertical "residuals" between points generated by the function and corresponding points in the data. The slope and offset of this trend line determine DCCT system scale factors, which are applied to the digitized feedback signal in the VME front end. • Linearity of fit is nearly identical with data sets of linear and logarithmic steps. • Use histogram to sample DCCT output at specific event • All DCCT systems were calibrated at least once a year and after any modifications to the systems.
Toroid Beam Intensity Monitoring System Sensor is a commercial wide-band tape-wound current transformer from Pearson Electronics. 0.5V/A into 50Ω +0.02% error / degF ~0.06% error / Gauss (f>100Hz) 3/8” Heliax or Trumpeter TWC2-78 for signal cable from toroid to electronics Presenter | Presentation Title
Switched Capacitor Integration Each external TTL trigger will cause switched capacitor circuit to cycle thru reset mode, integration mode, and hold mode. Systematic Errors : <1% Timing w.r.t. gate: ~0.14-0.16% error per usec Temperature Sensitivity : -0.01% error / degF The integrated value is buffered and continuously sampled by a 12bit or 14bit MADC for the control system before the next trigger. Absolute Accuracy: <±2% Pulse-to-Pulse Stability : <0.5% Presenter | Presentation Title
Digital Integration • For each external TTL trigger, the toroid signal is sampled at 125MHz, baseline corrected, integrated, and saved into registers readable across the VME backplane. • Upon request, the VME controller card reads out these registers into the control system. The microprocessor also does any pulse-to-pulse averaging or running sums of the report intensity for beam budget monitors or efficiency calculations. • Provides comparable absolute accuracy : <±2% • Varying time of arrival pulse with fixed width and fixed integration width • 0.186% change / 4usec delay • Varying integration gate with constant 20usec pulse width • Poor SNR is evident ~x5 larger variations in L20TOA when the signal only occupies 16% of the integration window versus 80% of the window. • -2.3% changes when the pulse occupies <20% of the integration window. • Varying calibration pulse width in fixed 125usec integration gate • 0.77% change as the pulse width was increased from 20usec to 124usec • SNR also improved as the pulse occupied more of the integration window. Presenter | Presentation Title
Toroid Calibration Procedure Dedicated Calibration Equipment : HP 33120A Measured 50.540Ω internal source resistance 0.5% change in gain for 1% change in output termination accuracy Calibration impedance is measured to <0.1% Calibration signal needs to mimic true beam Timing of calibration pulse within integration gate should be relatively similarly to beam Calibration trigger, burst rate, and burst count should be comparable to the fastest rep rate of beam transfers Calibration pulse width should be maximum width of envelope of macropulse of beam transfer Variations in amplitude should cover most of dynamic range of expected beam intensities Changes to scaling gain based on least squared fit between expected intensity and measured intensity All toroid systems were calibrated at least once a year, and after any modifications to the systems. Electronics Presenter | Presentation Title
Tuning machine based on beam loss Controller card calculates the instantaneous rate of change in the reported beam current at any given energy in the machine. This presents an instantaneous snapshot of the entire energy lost in the machine and can be used to tune the machine. This is comparable to the total activation measured by location-specific BLM or radiation surveys.
The time profile of losses (LQ230) due to the primary collimator are shown in blue. The green line shows beam intensity (DCCT). Beam position at the primary collimator (HP230) is shown in yellow. The beam energy loss (DCCT change times energy) is in red. Changes in the radial position of the primary collimator result in moving the time of this loss.
Comparing intensity monitors to determine efficiencies A histogram is used to determine transfer line efficiency between the reported DCCT intensity sampled on extraction event and upstream toroid in the NuMI transfer line.
Linear fit between DCCT intensity sampled on injection event and toroid in RR->MI transfer line. Linear fit between summed intensity at RR injection toroid and toroid in RR->MI transfer line.
Recycler DCCT (Installed in 2007) Bergoz NPCT-113-C100-HR : 113mm ID, high resolution with modulation frequency of 31.5kHz and set to a full-scale range : +/-2A Signal cable is 100m, non-halogen, low-smoke, flame retardant polypropylene cable. (IEC 544-4 Radiation index estimate 5.5-5.9)
Temperature Sensitivity From the datasheet, the Bergoz system is dominated by the sensor temperature drift of electronics has a <0.1 uA/K temperature drift while the sensor has 5 μA/K (0.035 e10/degC ) drift. As part of installation, the RR DCCT was baked up to 80degC. The datalogger measured -0.067 e10/degC or 9.64uA/degC at 52.81MHz.
DCCT Housing and Shielding Originally, Bergoz PCT-113-0100MA was purchased for Recycler. It had a 7kHz modulation frequency and a 20 kHz bandwidth. A copper housing enclosed the sensor and a ceramic insulator.
In 2000, it was moved to a new location, where there was a nearby Main Injector dipole magnet bus. The magnetic field from the now nearby Main Injector bend buss induced a substantial error in the measured beam charge. The observed errors were about 1e10, corresponding to 1 mA or 10 gauss. According to the manual, the transformer has a 100 µAmp/gauss radial sensitivity to magnetic fields. Typical magnetic fields from the buss are a few gauss.
Without any shielding (MI30) With magnetic shielding (MI62)
A cylindrical sleeve was constructed of 80% nickel-iron-molybdenum alloy with an initial relative magnetic permeability >25000. The alloy was annealed after all machining and forming. This shield was 9” in diameter and 18” long and reduced the magnetic field by 22 dB. Presenter | Presentation Title
A second layer was added to increase the shielding factor. Inner support pieces made of G-10 Fiberglass Epoxy maintain a 5/8” air gap between the 2 layer. Closing the ends of a cylindrical shield with shielding disks, or flanges, adds very little to the shielding factor.
RR DCCT Ceramic Break Configuration Ceramic break is commercial 4.0” ID isolator made of Alumina Ceramic with 52 Nickel iron weldable lips. The Bergoz manual advises that the gap capacitance should be more than 10 nF and less than 220 nF. The gap network was first modified to match the recommended maximum value. Presenter | Presentation Title
However ,the typical time structure of Recycler beam contains harmonics of the 89811 Hz rotation frequency. These high frequency components of the beam are suppressed with a capacitive network across the ceramic break. At the first rotation harmonic, 200 nF is 8.9 ohms and provides little or no effect. The capacitor network across the ceramic break was replaced with 88uF. Presenter | Presentation Title
The system’s swept frequency response snd noise spectrum remains unchanged with 88uf. The 31.5KHz spike is the modulating frequency used in the NPCT. Presenter | Presentation Title
Although large ceramic gap capacitance improved bunch length sensitivity, nonlinearity still a problem with slip-stacked beam. Presenter | Presentation Title
Bergoz DCCT response with slip-stacked RR beam. New DCCT response with slip-stacked RR beam.
Front end specifications ±5 Volts differential input range via buffer amplifier Bandwidth (3rd order LPF): 530Hz Temperature sensitivity: 98uV/ ºC (.007e10/ ºC) Noise:1uV rms 2880Hz sample rate 720Hz data rate 18 effective number of bits 108db S/N ratio Linearity = .006% .04e10 Measurement of a D cell battery demonstrates 19.4 ENOB rms noise from the ICS-110B. This is better than the manufacturers specification but does not include non-linearity error. The equivalent noise level would be 0.48uAmp rms for a 400mA full scale range. Presenter | Presentation Title
MiniBooneToroids (2004) Plot showing the temperature correlation between two transport beam intensity monitors (red and cyan) and the room temperature (green). Both toroid monitors are 1x10¹³ at full-scale intensity with an 11 msec integration gate. The plot shows about 3.4x10⁹ variations due to the temperature change. The plot above compares fluctuations in gain over time between transport beam intensity monitors with (blue) and without (green) electronic modifications. The gains were tracked during successive calibrations in between beam transfers over several days and were calculated using a least squares fit model between measured intensities and expected intensities. Although both show ±0.5% long-term gain drift (red arrow bars), the new electronics show ±0.1% RMS pulse-to-pulse variation, in contrast to ±0.3% in the older electronics (purple arrow bars).
A fast time is used to compare the difference between RR DCCT intensity and RR abort toroid. Presenter | Presentation Title
A fast time is used to compare the difference between RR DCCT intensity and RR abort toroid. R:TOR853 and I:TOR806 agree injection-by-injection. R:SE3853 is 3.12% higher than R:TOR905.