Download
1 / 25
310 likes | 1.19k Vues
SIMS-201. Introduction to Audio Information. Characteristics of Audio Signals Sampling of Audio Signals. Overview. Chapters 10-11 Background on audio signals Period, frequency and amplitude Audio signal components Sampling rate Undersampling and Oversampling

E N D
SIMS-201 Introduction to Audio Information Characteristics of Audio Signals Sampling of Audio Signals
Overview Chapters 10-11 • Background on audio signals • Period, frequency and amplitude • Audio signal components • Sampling rate • Undersampling and Oversampling • Reconstructing audio from samples
Background on Audio Signals • Sound is created by the motion of air particles in space (by applying mechanical force to air – ex. dropping a book on the floor will expand energy. Energy will move air around, which motion is perceived as sound.) • The changes in air pressure can be measured and recorded, for example by using a microphone(converts the air motion into an electrical signal) • We recall the “hello” wave of human voice:
Properties of audio signals • Audio signals have frequency components that are complex • In other words, most audio signals are made up of several frequencies, combining to make the sound we recognize • The standard for human voice is taken to vary from about 100 Hz to 3000 Hz • Piano: Concert A above Middle C is 440 Hz • Lowest audible frequency for humans is around 20 Hz (A low, rumbling bass note) • Highest audible frequency is 20 kHz (beyond the range of most humans, but can be heard by dogs)
Notice the faster rate at which the ear can detect stimulus changes compared to the eye (ear can detect rates up to 20,000 per second, eye can detect only 50 times per second) • This needs to be taken into account when converting audio information into digital form-we need to use far more samples per second of information for audio
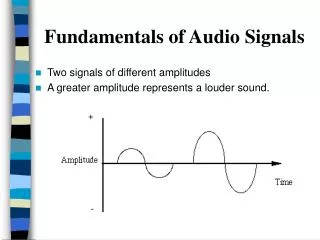
Period, Frequency & Amplitude • Hz (Hertz) is a measure of frequency f (number of cycles (times) a wave repeats itself per second). In our case - how rapidly the audio signal is changing. • If the frequency of a signal is 2Hz, then 2 cycles of the wave are completed per second • Period T, measured in seconds (s) is the time it takes to complete one cycle of the wave • Frequency and period are Inversely Proportional: • T=1/f • f=1/T • If the frequency of the signal is 2Hz, then the period is 0.5 s (i.e. it takes 0.5 seconds for the wave to complete one cycle) • Amplitude is the magnitude of the signal at a given point in time. For example - volts. • Amplitude relates to volume • Louder sounds have greater vertical displacement of sound wave
Frequency : f=1/(10x10-3)=100 Hz One cycle of the wave 4 V Period: T=10 ms 3 V 2 V 1 V Amplitude: A=4 V Amplitude: A=3 V 0 V -1 V Amplitude: A=-2 V -2 V -3 V -4 V 0 5 10 t (ms)
Signal with twice the frequency 4 V 3 V Notice the period is half the value as before 2 V 1 V Period: T=5 ms 0 V Notice the frequency is twice the value as before -1 V -2 V Frequency : f=1/(5x10-3)=200 Hz -3 V -4 V 0 5 10 t (ms)
Let’s listen to sine waves with various frequencies: http://www.mindspring.com/~scottr/zmusic/
Multipliers The following are the common multipliers used for audio characteristics such as period (T) and frequency (f): • Giga (G) 109 1,000,000,000. • Mega (M) 106 1,000,000. • Kilo (k) 103 1,000. • milli (m) 10-3 .001 • micro () 10-6 .000001 • nano (n) 10-9 .000000001 For example, KHz = KiloHertz = 1000 Hz ms = millisecond = 1/1000 = .001 seconds
Audio Signal Components Concert “A” on a vibraphone Sound waves are the sum of simple pure tones
Frequency composition (spectrum) of a signal The different frequency components which are added together to produce a complex waveform are called the frequency spectrum of that waveform.
Sound Wave Vs. Frequency Spectrum • Fortunately, we do not need to know the specific frequency content of a signal to digitize it. • We only need to know the highest frequency component the signal might contain (called the bandwidth – a band or range of frequencies that the signal occupies). Why? Note there is not much frequency content above 1 KHz
Fourier Transform • In the early 19th century, the French mathematician Fourier proved that all waveforms, whether musical or not, can be constructed out of a sum of pure tones. • The implications of this are that every audio waveform – whether speech, music , or any other sound – can be built out of sinusoids at certain frequencies. • The different frequency components (pure tones) which are added together to produce a complex waveform are called the frequency spectrum of that waveform. • Signals can be converted from time domain (how the wave varies with respect to time) to frequency domain by using Fourier transform (formula).
Digitizing Audio Signals • In previous lectures, we learned how continuous images are digitized first by dividing the image into a certain number of pixels, then determining the brightness level of each pixel and finally assigning a binary code of certain length (number of bits) to each pixel. • A similar procedure is used to digitize audio signals. • The first step is called “sampling” where the waveform is sampled at certain intervals. • The second step, called “quantization,” involves rounding off the continuous values of the audio samples so they can be represented by a finite number of bits.
Two step process for digitizing audio • Continuous function of time • Infinite amount of information • Must choose particular instants of time (samples) STEP 1 STEP 2 Continuous Audio Signal Quantized into a Series of Binary Digits Made Discrete In Time
Sampling Rate • Sampling Interval (T) • Amount of time separating the samples • Also called sampling period • Sampling Rate (fs) • Number of samples per second • Also called sampling frequency The sampling rate determines how many values of the signal we choose to retain. Ts = 1/fs or fs = 1/Ts Sampling IntervalSampling Rate 1 milliseconds 1 kHz = 1000 samples/sec 4 milliseconds 250 Hz = 250 samples/sec 16 milliseconds 62.5 Hz = 62.5 samples/sec
Digital Telephone Example In a digital telephone system, the speech signal is sampled 8,000 Hz. What is the sampling period? Ts = 1/fs Ts = 1/8000 Ts = .000125 = 1.25 x 10-4 = 125 s
Nyquist Sampling Frequency How often do you sample? The sampling rate depends on the signal’s highest frequency (for baseband) • Harry Nyquist, working at Bell Labs developed what has become known as the Nyquist Sampling Theorem: • In order to be ‘perfectly’ represented by its samples, a signal must be sampled at a sampling rate (also called sampling frequency) equal to at least twice its highest frequency component • Or: fs = 2f • Note that fs here is the sampling rate (frequency of sampling), and f is the frequency of the signal
Sampling Rate Examples • Take Concert A: 440 Hz • What would be the minimum sampling rate needed to accurately capture this signal? • fs = 2 x 440 Hz = 880 Hz • Take your telephone used for voice, mostly • Highest voice component is: 3000 Hz • Minimum sampling rate: fs = 2 x 3000 Hz = 6000 Hz • Real telephone digitization is done at 8000 Hz sampling rate (supporting a 4 kHz bandwidth). Why? We recall that Nyquist determined “equal to at least twice…”
Undersampling and Oversampling • Undersampling • Sampling at an inadequate frequency rate (too low) • Aliasing - Aliased into new form (can lead to completely incorrect signal being reconstructed: has a new identity hiding the original form from us) • Loses information in the original signal • Oversampling • Sampling at a rate higher than minimum rate • Generation of additional, unnecessary samples - more values to digitize and process • Increases the amount of storage and transmission • and therefore, the COST $$
Effects of Undersampling Original waveform Reconstructed waveform
Reconstructing Audio from Samples • After receiving the signal, it is necessary to reconstruct it in order to hear it. • The signal is reconstructed from its samples. • Exact reconstruction is possible if the sampling rate is sufficiently high.
Reconstructed speech waveform with 1 KHz sampling rate (note the resulting waveform does not resemble original waveform) A short section of a speech waveform (highest frequency component is 3KHz)
Reconstructed speech waveform with 5 KHz sampling rate (the resulting waveform starts resembling the original waveform) Reconstructed speech waveform with 10 KHz sampling rate (the resulting waveform highly resembles the original waveform)