
Library Online Resource Analysis (LORA) System
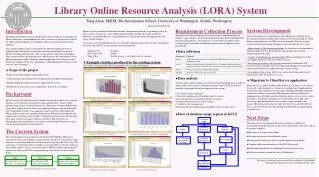
Input. Process. Output. Reports and Charts (MS Excel environment). Server log data ( text file with .csv extension). Logs Database (MS Access environment). Library Online Resource Analysis (LORA) System. Tariq Alam, MSIM, The Information School, University of Washington, Seattle, Washington

Library Online Resource Analysis (LORA) System
E N D
Presentation Transcript
Input Process Output Reports and Charts (MS Excel environment) Server log data ( text file with .csv extension) Logs Database (MS Access environment) Library Online Resource Analysis (LORA) System Tariq Alam, MSIM, The Information School, University of Washington, Seattle, Washington talam@u.washington.edu System Development After analyzing the new requirements and studying the scalability issue, the team has decided to migrate the existing system from the MS ACCESS database environment to the SQL server environment. The new system would provide the following advantages and would satisfy users’ needs. • Improvement of file sharing mechanism: the client/server environment of Microsoft SQL Server is designed for a large number of users and minimizing network traffic • Capable of handling large amount of data: Microsoft SQL Server 2000 can support databases of up to 2 terabytes in size • Increasing the security of the system: Integration of Microsoft SQL Server's security with the security of a Microsoft Windows network allows easier administration of complex network security settings • Availability of the system: SQL Server can be backed up and restored dynamically while the database is in use • Migration to Client/Server application • Microsoft Access 2000 introduces Microsoft Access Project, a new type of Access file (.adp) designed as a client/server application. Communication between the client and the server takes place through OLE DB component architecture, which was specifically designed for efficient client/server communication. All tables and data definition objects such as views, stored procedures, and database diagrams are stored on the server. The client stores only code-based objects such as forms, reports, modules, and macros. Most data processing takes place on the server, and only filtered data is sent to the client, thus minimizing network traffic and speed up the overall process. Introduction Electronic information resources and databases have become an essential part of library collections. Understanding how these resources are being used is critical for collection development, accountability, library management and strategic planning. The existing database analysis tool allows the library management team to understand how the databases and other electronic information resources of KCLS are being used by patrons. The existing tool has limitation in handling large amount of data and producing new statistics as per the requirements of the library management team. Therefore understanding how the existing system is being used, finding out the new requirements, and upgrading the existing system were the aims the project. • Scope of the project • Study the existing database usage analysis tool • Understand how the existing tool is being used by the library management • Identify additional requirements to be added into the system • Modify the system to meet new requirements and test the scalability Background • KCLS licenses 55 databases from 26 vendors and provides online access to these databases in 43 branches and remotely using authentication. Some vendors provide usage statistics of their databases by library users. Vendor supplied data vary widely in the content of their usage reporting. Reports range from detailed lists of individual searches to an aggregate usage count for a reporting period. When similar statistics are supplied, differences in definition and scope prevent comparison of statistics across vendors. Common areas of inconsistency include: Time span; Session or instance; Queries and Views. The University of Washington team studied those usage reports and developed a database analysis tool for normalizing those inconsistencies. • The Current System • The existing database usage analysis tool has been developed in MS Access environment. The system produces many statistics based on server log data usage. Statistics are generated either for each branch or for the entire KCLS system. The system has several menu buttons, dropdown and check boxes in the user interface. It has tables, queries, forms, macros and utilizes MS Excel sheets and graphs to generate the final reports. The conceptual design view of the system is shown below • Reports can be generated for individual months, comparison of months, or spanning a range of dates, such as a quarter or a year. Additional functionality includes the ability to add new databases, reassign IP addresses, assign databases to a particular vendor for aggregation, and create custom statistics. • 16 statistics were developed based on server log data. Statistics generated, for either each branch or for the entire KCLS system, include activity grouped by : • Month or Year Database • Day of the week Vendor • Time of day Remote access vs. in-branch activity summary • Example statistics produced by the existing system The statistics are exported to Excel spreadsheets for viewing and charting. • Requirement Collection Process • The project team has conducted several interviews to understand how the database usage statistics are being prepared and used in KCLS and helped the decision making process. The interviews focused on the usability of the existing system and collected additional requirements to improve system functionality. • Data collection • Data analysis The data analysis phase mainly concentrated on the following areas in order to understand how the statistics and tools are being used by KCLS and what would be the possible future development to the system • User characteristics and tasks • Objectives and purposes of task that relate to statistics • Decisions made by management based on statistics • Internal and external users of the statistics • Usability of the existing tools • Requirements for improving functionalities of the existing system • Flow of database usage reports in KCLS Average Monthly Activity by Branch Month and Year Statistics Next Steps The project has so far migrated the Access databases to SQL server environment for improving the overall system performance. The next steps of the project would be: • Edit and test the queries and forms • Develop new queries and additional reports • Installing and testing the new system performance and usability • Continue collection and analysis of the KCLS data itself • Work with other libraries in adopting these statistical measures • Publicize measures beyond the state of Washington Activity by Database Vendor Average Database Use by Day of the Week This project is under the supervision of Professor Efthimis N. Efthimiadis The Information School, University of Washington WA, USA. Conceptual design of current system Branch Activity per Computer Access by Time of Day


![[PDF] Free Download Cross Breed By Lora Leigh](https://cdn4.slideserve.com/8023271/slide1-dt.jpg)