Download
1 / 11
110 likes | 221 Vues
This workshop examines key challenges and questions regarding climate data, seasonal forecasts, and projections for the next 20-30 years, focusing on the impacts of climate variability on sectors such as agriculture and public health. We discuss the importance of understanding the onset of rainy seasons, drought conditions, and the quality of rainfall. Attendees will explore examples of research, including monsoon onset in Senegal and malaria forecasts in Botswana, while considering the need for reliable climate data and the role of humanitarian agencies in responding to climate challenges.

E N D
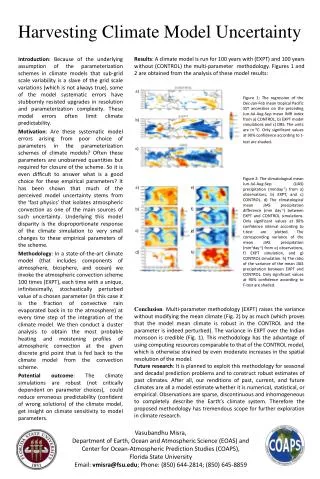
Tolerating the Right Kinds of UncertaintyTranslational Climate Model and Data Analysis Andy Morse, Cyril Caminade, Dave MacLeod, Anne Jones School of Environmental Sciences, University of Liverpool, Liverpool A.P.Morse@liv.ac.uk Workshop at UKCDS - London, May 2012
Overview User questions and needs Climate Data, Seasonal Forecasts, Climate Projections (today +/- 30 years, +6 months) Research examples Challenges
User Questions and Needs • How important is the role of climate? • Rank impacts of climate. • Specifically – • Onset and cessation of rainy season • Quality of rainy season e.g. frequency of long break cycles • Trends in drier* than, average years or ’seasons’ • * wetter, hotter, colder • Onset of drought • Sector focused? Concentrate on sector common questions.
Data and models Define current climates – gridded data – reanalysis, satellite, observations; station data (access and quality issues) Seasonal Forecasts (forthcoming rains, seasonal temperatures) Climate Projections (for near future +20 years, changes in seasonal or annual means and distributions)
Research Examples – Gridded Data Monsoon onset climate in Senegal. Mean onset of the rainy season (per decades or 10 days) based on the Hachigonta criterion: First decade with 25mm followed by two decades of 20mm. Based on the TRMM satellite data for the period 1998-2008.
Research Examples – Seasonal Forecasts Decision threshold, P DEMETER multi-model malaria forecasts for upper tercile malaria, Botswana, November forecast months 4-6 (FMA), compared to observed anomalies from published index. After Jones and Morse, 2010, J Climate. 6 hits, 1 miss 4 false alarms and 9 correct rejections.
Research Examples Temperature ‘PDF” type figure for Kaffrine in Senegal for the dry based on the SRESA1B ensemble. Future climate (2030-50) is compared to the recent climatic context (1990-2010). An average of four grid points around the region was retained for the eight ENSEMBLES Regional Climate models. The envelope depicts the spread in the multi-model ensemble (two standard deviations of the model ensemble)
Challenges Need for honest (independent) broker of climate model data Stronger science base and science use by humanitarian agencies (perhaps through mutual body?) Questions of climate science research interest that also benefit humanitarian agencies i.e. dual question Key Humanitarian Challenge for Climate Scientists – Develop sustained community use of seasonal forecast products (rainfall) by demonstrating real world economic value
Cost-loss assessment (DEMETER) DEMETER (ROCA=0.67) ERA-40 (ROCA=0.88) Theoretical cost/loss versus potential economic value, V For probability forecasts, choose decision threshold to maximise value V Cheap to take action (always act) Expensive to take action (never act) Malaria forecasts for above upper tercile malaria, Botswana, November forecast months 4-6 (FMA), compared to observed anomalies from published index. after Jones and Morse, 2010 JClimate