Download
1 / 26
260 likes | 416 Vues
14.8% Increase in Avg. Selling Price/Unit Category Average Selling Price per Unit increased $0.13 to $1.01 for Jan. ‘11 over Jan. ‘10. 51,071 Facebook Fans Total California Avocado fans that have been acquired as of February 28, 2011. 105 Million Consumer PR Impressions

E N D
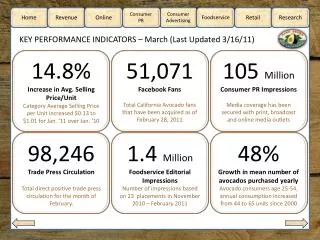
14.8% Increase in Avg. Selling Price/Unit Category Average Selling Price per Unit increased $0.13 to $1.01 for Jan. ‘11 over Jan. ‘10 51,071 Facebook Fans Total California Avocado fans that have been acquired as of February 28, 2011 105 Million Consumer PR Impressions Media coverage has been secured with print, broadcast and online media outlets KEY PERFORMANCE INDICATORS – March (Last Updated 3/16/11) 98,246 Trade Press Circulation Total direct positive trade press circulation for the month of February. 1.4 Million Foodservice Editorial Impressions Number of impressions based on 23 placements in November 2010 – February 2011 48% Growth in mean number of avocados purchased yearly Avocado consumers age 25-54, annual consumption increased from 44 to 65 units since 2000
REVENUE - California Season Retail Price Premium Avg. Retail Price $1.16 Avg. Retail Price $1.02 Avg. Retail Price $0.97 Off-season California “season” California “season” April – Sept 2009 Nov 2010 – Jan 2011 April – Sept 2010
ONLINE – Social Media Overview • The California Avocado Commission social media community continued to grow in February. Highlights include a 12% increase in impressions on Facebook and double the number of unaided fan posts to the Page. Fans utilized the Page to ask questions about recipes and usage and share their enthusiasm for California Avocados, recipes and events. The monthly consumer recipe e-mail peaked traffic to the page when it was disseminated on February 10th. • Twitter followers increased by 8% with a corresponding 26% increase in reach of replies and a 107% increase in reach of retweets. Followers engaged most around the upcoming launch of the California Avocado season and Camp Blog Away. The CAC account also followed 50 new influencers. • YouTube channel views increased by 20% during February, aided by a Facebook status update that linked to Supporting the California Avocado on February 11th. The Too Hot Tamales Liven up the Frittata video continues to have the most overall views and received 111 additional views during February.
ONLINE – Facebook, Twitter & YouTube • TWITTER • New Followers: 117 • Total Followers: 1,617 • Retweets: 16 • Replies Reach: 29,577 • Retweets Reach: 15,210 • YOUTUBE • YouTube Channel Views: 438 • Total Channel Views: 2,561 • GLOSSARY – Facebook & Twitter: • Avg. Interaction Per Post: Average number of comments and likes generated by each post. • Organic Fans: The number of new fans not added through Facebook Pay-Per-Click (PPC). • Post Impressions: The number of times the post has been rendered on user’s browsers. This can come • from a user’s news feed, live feed, directly from the Page or through the Fan Box Widget. • Replies & Retweets Reach: Sum of the number of followers for each reply or retweet. Adds up how • many followers would see it depending on how many followers a user has.
ONLINE – Web Analytics Year Over Year (YoY) visits are 21% higher than our goal and Average Time on Site is up 12% YoY. We are off to a strong start in 2011 against the goals. We saw an increase in Month Over Month (MoM) and are 21% above our visits goal for February 2011 The “Best Guacamole Ever” recipe was seen by 10% of visits, and traffic was driven primarily by Stumble Upon. 25% of those visits, nearly 2,000 visits, continued beyond this specific recipe page. The Retailer site traffic is down YoY, but the % of Return visits is up 14%, Page Vies is up 15% and the Average Time on the site is up 24% With a combined traffic rank of 52%, Nutrition and Recipes continue to be the most visited areas of the website. Average time on Nutrition page is 1.31 minutes. There was increased interest in growing avocado trees with the second highest time spent on a page of 2.56 minutes.
ONLINE – Web Analytics (Competitive Overview Jan. 2011) CAC’s website continues to outpace other avocado association’s website. CAC has three times the traffic has MHAIA’s website and six times the traffic as HAB. Website traffic was down on all websites except MHAIA who did heavy advertising during the month of January. Compete.com tracks Unique Visitors, while in Google Analytics we primarily look at Visits. Incentives or promotions may have a significant impact on Unique Visitors, as they drive traffic, but this traffic may not necessarily "stick" or continue visiting. Source: Compete.com. February data not listed because Compete’s data is not available until the 16th of the month.
PUBLIC RELATIONS - Highlights • Fulfilled ongoing reactive requests by media covering California Avocados • Worked with Artisan chef partners to promote California Avocados through their communications channels • Received tertiary coverage of content and recipes placed in the “Best of the Sunset Cookbook” based off of coverage secured in the April 2009 Sunset issue • Began development of key media outreach activities for the upcoming season
PUBLIC RELATIONS – Media Impressions • The total consumer impressions secured to date is: 105,100,838 • The total consumer impressions secured since the last update is: 45,804,992 *This is a comprehensive total of all PR-related coverage from November 1, 2010 – February 28, 2011. It includes print, broadcast and online coverage, as well as program extension coverage (such as Facebook posts and Tweets from our Artisan Chefs, etc.), year-to-date, and therefore is higher than traditional media impressions
CONSUMER ADVERTISING – America’s Test Kitchen On-air and online :05 sponsorship segments AmericasTestKitchen.com website placements
FOODSERVICE – Editorial Placements Number of placements in foodservice editorial in February 2011 - 4 placements (237,000 impressions) Number of placements in foodservice editorial from November 2010 – January 2011 - 23 placements (1,410,422 impressions)
FOODSERVICE – Advertising Three new print ads were created for the CAC Foodservice Program to run in 2011. Ads will run in Food Arts, Food Management, Plate and Restaurant Hospitality.
RETAIL –Editorial Placements Total positive direct CAC trade press circulation = 98,246 for the month of February With four months into the fiscal year, total year-to-date positive direct CAC trade press circulation is 303,258. .
RETAIL – Ad Placements • 9 ads featured California Avocados from November 2010 – February 2011
RETAIL – Display Bins CAC has sent a total of 8 Retail Display Bins from November 2010 through January 2011 to the following retailer:
RETAIL – Point of Sale Materials • CAC has sent the following quantities of Point-of-Sale Materials to retailers from November 2010 to date: • Over 50 POS Cards • Over 30 Recipe Tear Pads • Over 10 Ripe Sticker Rolls • Over 50 Avocado Danglers
RESEARCH– Growth in Purchases Leads to Growth in ConsumptionPeople consuming avocados has risen 48% in the past 10 years, and numbers show that 2010 is back up to pre-recession numbers Average # of avocados purchased by household* per year in the U.S. *Households between the ages of 25-54 that consume avocados Source: HAB Avocado Consumer Tracking Study by Cooper Roberts
RESEARCH – More Avocados in the HomeHome consumption in the Ad Markets and Remaining U.S. has increased significantly over time, suggesting that consumers are eating more avocados more often. Source: HAB Avocado Consumer Tracking Study by Cooper Roberts
RESEARCH– Look What’s in SeasonAdvertising and targeted promotions around California Avocados peak season between spring and summer drive purchasing behavior Source: HAB Avocado Consumer Tracking Study by Cooper Roberts
RESEARCH – Ad Markets are Where the Heavier Users Are62% of the Ad Markets were classified as Heavy/Super Users, while just under half of the Remaining U.S. fall under this category Ad Markets 2010 Remaining U.S. 2010 Light, 11% Light, 18% Super, 17% Super, 28% Medium, 27% Medium, 32% Heavy, 32% Heavy, 34% Light 1-12 Medium 12-16 Heavy 37-119 Super 120+ Source: HAB Avocado Consumer Tracking Study by Cooper Roberts