Human Brain and Nervous System
Explore the complexity of the human brain and nervous system, with 100 billion neurons communicating to control various functions. Learn about different nervous system structures and pathways in animals, from simple nerve nets to the central and peripheral nervous systems. Understand neuron structure, supporting cells, and techniques for measuring membrane potential.

Human Brain and Nervous System
E N D
Presentation Transcript
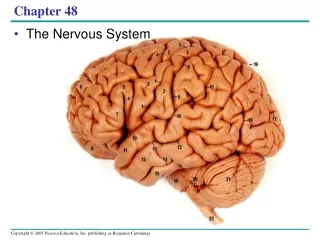
Chapter 48 • The Nervous System
Command and Control Center • The human brain • Contains an estimated 100 billion nerve cells, or neurons • Each neuron • May communicate with thousands of other neurons
Figure 48.1 • Functional magnetic resonance imaging • 3-D map of brain activity
Brain imaging reveals groups of neurons function in specialized circuits dedicated to different tasks
Nerve net Figure 48.2a (a) Hydra (cnidarian) Organization of Nervous Systems • Simplest animals nerve nets
Radialnerve Nervering Figure 48.2b (b) Sea star (echinoderm) • Sea stars nerve net connected by radial nerves to a central nerve ring
Eyespot Brain Nerve cord Transversenerve Figure 48.2c (c) Planarian (flatworm) • Simple cephalized animals, e.g. flatworms • central nervous system (CNS)
Brain Brain Ventralnerve cord Ventral nervecord Segmentalganglia Segmentalganglion Figure 48.2d, e (d) Leech (annelid) (e) Insect (arthropod) • Annelids and arthropods • Segmentally arranged clusters of neurons called ganglia • Ganglia connect to the CNS • and make up a peripheral nervous system (PNS)
Anteriornerve ring Ganglia Brain Longitudinalnerve cords Ganglia (g) Squid (mollusc) (f) Chiton (mollusc) Figure 48.2f, g • Molluscs • Sessile molluscs simple systems • Complex molluscs sophisticated
Brain Sensoryganglion Spinalcord (dorsalnerve cord) Figure 48.2h (h) Salamander (chordate) • Vertebrates • CNS brain and dorsal spinal cord • The PNS connects to the CNS
Sensory input Integration Sensor Motor output Effector Central nervoussystem (CNS) Peripheral nervoussystem (PNS) Figure 48.3 Information Processing • 3 stages • Sensory input, integration, and motor output
Sensory information is sent to the CNS • Where interneurons integrate the information • Motor output leaves the CNS via motor neurons • Communicate with effector cells
2 6 5 4 3 1 Gray matter Sensory neurons convey the information to the spinal cord. Sensors detect a sudden stretch in the quadriceps. The sensory neurons communicate with motor neurons that supply the quadriceps. The motor neurons convey signals to the quadriceps, causing it to contract and jerking the lower leg forward. Cell body of sensory neuronin dorsal root ganglion Sensory neurons from the quadriceps also communicate with interneuronsin the spinal cord. Quadricepsmuscle Hamstringmuscle White matter The interneurons inhibit motor neurons that supply the hamstring (flexor) muscle. This inhibition prevents the hamstring from contracting, which would resist the action of the quadriceps. Spinal cord(cross section) Sensory neuron Motor neuron The reflex is initiated by tapping the tendon connected to the quadriceps (extensor) muscle. Interneuron Figure 48.4 • 3 stages in the knee-jerk reflex
Dendrites Cell body Nucleus Synapse Signal direction Axon Axon hillock Presynaptic cell Postsynaptic cell Myelin sheath Synapticterminals Figure 48.5 Neuron Structure
Dendrites • Receive signals from other neurons • Axon • Transmits signals to other cells at synapses • May be covered with myelin sheath
Dendrites Axon Cell body (c) Motor neuron (b) Interneurons (a) Sensory neuron Figure 48.6a–c
Supporting Cells (Glia) • Structural integrity & normal functioning of neurons
50 µm Figure 48.7 • In the CNS, astrocytes • structural support for neurons
Node of Ranvier Layers of myelin Axon Schwann cell Schwann cell Nodes of Ranvier Nucleus of Schwann cell Myelin sheath Axon 0.1 µm Figure 48.8 • Oligodendrocytes (in the CNS) and Schwann cells (in the PNS) • glia that form the myelin sheaths around the axons
Ion pumps and channels maintain the resting potential of a neuron • Every cell has a voltage • Called a membrane potential • The inside of a cell is negative (-) • Relative to the outside
TECHNIQUE APPLICATION Electrophysiologists use intracellular recording to measure the membrane potential of neurons and other cells. A microelectrode is made from a glass capillary tube filled with an electrically conductive salt solution. One end of the tube tapers to an extremely fine tip (diameter < 1 µm). While looking through a microscope, the experimenter uses a micropositioner to insert the tip of the microelectrode into a cell. A voltage recorder (usually an oscilloscope or a computer-based system) measures the voltage between the microelectrode tip inside the cell and a reference electrode placed in the solution outside the cell. Microelectrode –70 mV Voltage recorder Referenceelectrode Figure 48.9 • Measurement
The Resting Potential • Membrane potential of a neuron that is not transmitting signals
EXTRACELLULARFLUID CYTOSOL + – [Na+]15 mM [Na+]150 mM + – [K+]5 mM [K+]150 mM – + [Cl–]10 mM [Cl–]120 mM – + [A–]100 mM – + Plasmamembrane Figure 48.10 • Depends on ionic gradients
Conc. of Na+ is higher in the extracellular fluid than in the cytosol • K+ higher in cytosol
Gated Ion Channels • Open or close in response to a change in the membrane potential
Action potentials • Signals conducted by axon
Stimuli +50 0 Membrane potential (mV) Threshold –50 Restingpotential Hyperpolarizations –100 0 1 2 3 4 5 Time (msec) (a) Graded hyperpolarizations produced by two stimuli that increase membrane permeability to K+. The larger stimulus producesa larger hyperpolarization. Figure 48.12a • hyperpolarization • Increase in the magnitude of the membrane potential
Stimuli +50 0 Membrane potential (mV) –50 Threshold Restingpotential Depolarizations –100 0 1 2 3 4 5 Time (msec) (b) Graded depolarizations produced by two stimuli that increase membrane permeability to Na+.The larger stimulus produces alarger depolarization. Figure 48.12b • depolarization • Reduction in the magnitude of the membrane potential
Stronger depolarizing stimulus +50 Actionpotential 0 Membrane potential (mV) Threshold –50 Restingpotential –100 0123456 Time (msec) (c) Action potential triggered by a depolarization that reaches the threshold. Figure 48.12c Production of Action Potentials • A stimulus strong enough to produce a depolarization that reaches the threshold action potential
Action potential • Brief all-or-none depolarization of a neuron’s plasma membrane • Signal that carries information along axons
– – – – – – + + + + + + + + + + + + – – – – 3 4 3 + + + + + + + + 2 4 – – – – – – – 5 1 1 Depolarization 2 + + + + Extracellular fluid Activationgates Potassiumchannel – – – – Plasma membrane – 5 Inactivationgate 1 generation of an action potential Na+ Na+ 4. Falling phase of Acton Potential Na+ Na+ K+ + K 3. Rising phase of action potential Depolarization opens the activation gates on most Na+ channels, while the K+ channels’ activation gates remain closed. Na+ influx makes the inside of the membrane positive with respect to the outside. Actionpotential The inactivation gates on most Na+ channels close, blocking Na+ influx. The activation gates on mostK+ channels open, permitting K+ effluxwhich again makesthe inside of the cell negative. Rising phase of the action potential +50 Na+ Na+ 0 Membrane potential (mV) –50 K+ –100 A stimulus opens the activation gates on some Na+ channels. Na+ influx through those channels depolarizes the membrane. If the depolarization reaches the threshold, it triggers an action potential. 2. Depolarization Resting potential 5. Undershoot Time Threshold Na+ Na+ Na+ + + K+ + + + + + + + + – – Undershoot Cytosol Both gates of the Na+ channelsare closed, but the activation gates on some K+channels are still open. As these gates close onmost K+ channels, and the inactivation gates open on Na+ channels, the membrane returns toits resting state. Sodiumchannel K+ 1. Resting state Figure 48.13 The activation gates on the Na+ and K+ channelsare closed, and the membrane’s resting potential is maintained.
Conduction of Action Potentials • Travels long distances by regenerating itself along the axon
– – + + + + + + – – + + + + + + Axon Actionpotential An action potential is generated as Na+ flows inward across the membrane at one location. 1 + + – – – – – – Na+ – – – – – – + + – – + + + + + + Actionpotential 2 The depolarization of the action potential spreads to the neighboring region of the membrane, re-initiating the action potential there. To the left of this region, the membrane is repolarizing as K+ flows outward. K+ – – – + – – + – Na+ – – – – – – + + – – + + + + + + K+ Actionpotential The depolarization-repolarization process isrepeated in the next region of the membrane. In this way, local currents of ions across the plasma membrane cause the action potential to be propagated along the length of the axon. 3 K+ – – – – + + + + – + + + + – – – Na+ – – – + + – + + – + + – – Figure 48.14 – + + K+ • At the site where the action potential is generated an electrical current depolarizes the neighboring region of the axon membrane
Conduction Speed • Increases with the diameter of an axon • Myelinated axons also faster
Schwann cell Depolarized region(node of Ranvier) Myelin sheath – –– – – – ++ + Cell body ++ ++ + Axon – – – ++ + – – – Figure 48.15 • Action potentials in myelinated axons • Jump between the nodes of Ranvier in a process called saltatory conduction
Neurons communicate with other cells at synapses • Electrical synapse • current flows directly from one cell to another via a gap junction • Most synapses are chemicalsynapses
Postsynapticneuron Synapticterminalof presynapticneurons 5 µm Figure 48.16 • Presynaptic neuron releases neurotransmitters, which are stored in the synaptic terminal
Postsynaptic cell Presynapticcell Na+ Neuro-transmitter Synaptic vesiclescontainingneurotransmitter K+ Presynapticmembrane Postsynaptic membrane Ligand-gatedion channel Voltage-gatedCa2+ channel Ca2+ Postsynaptic membrane 3 Synaptic cleft Ligand-gatedion channels 6 5 4 1 2 Figure 48.17 • When action potential reaches a terminal release of neurotransmitters into the synaptic cleft
Neurotransmitters • The same neurotransmitter can produce different effects in different types of cells
Table 48.1 • Major neurotransmitters
Acetylcholine • One of the most common neurotransmitters • Can be inhibitory or excitatory
Biogenic Amines • Include epinephrine, norepinephrine, dopamine, and serotonin
Gases • e.g. nitric oxide and carbon monoxide • local regulators in the PNS
Central nervous system(CNS) Peripheral nervous system(PNS) Brain Cranial nerves Spinal cord Ganglia outside CNS Spinal nerves Figure 48.19 Specialization and regionalization • High degree of cephalization and distinct CNS and PNS components in verts.
Brain integrative power • Spinal cord integrates simple responses to certain kinds of stimuli and conveys information to and from the brain
Gray matter White matter Ventricles Figure 48.20 • Spinal cord and 4 ventricles of the brain • Are hollow, (derived from the dorsal embryonic nerve cord)
The Peripheral Nervous System • Transmits information to and from the CNS • regulates movement and internal environment
Peripheral nervous system Somatic nervous system Autonomic nervous system Sympathetic division Parasympathetic division Enteric division Figure 48.21 PNS
Somatic nervous system • signals to skeletal muscles • Autonomic nervous system • Regulates internal environment, involuntary • Divided into the sympathetic, parasympathetic, and enteric divisions