Neurons, Synapses, and Signaling: Lines of Communication
Explore the organization, structure, and function of neurons in information transfer, including the transmission of electrical and chemical signals. Discover how neurons process sensory input, integrate information, and generate motor output.


Neurons, Synapses, and Signaling: Lines of Communication
E N D
Presentation Transcript
Chapter 48 Neurons, Synapses, and Signaling
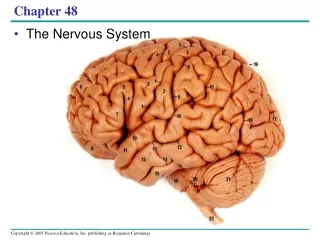
Overview: Lines of Communication • The cone snail kills prey with venom that disables neurons • Neurons are nerve cells that transfer information within the body • Neurons use two types of signals to communicate: electrical signals (long-distance) and chemical signals (short-distance)
The transmission of information depends on the path of neurons along which a signal travels • Processing of information takes place in simple clusters of neurons called ganglia or a more complex organization of neurons called a brain
Concept 48.1: Neuron organization and structure reflect function in information transfer • The squid possesses extremely large nerve cells and is a good model for studying neuron function
Introduction to Information Processing • Nervous systems process information in three stages: sensory input, integration, and motor output
Fig. 48-2 Nerves with giant axons Ganglia Brain Arm Eye Mantle Nerve
Sensors detect external stimuli and internal conditions and transmit information along sensory neurons • Sensory information is sent to the brain or ganglia, where interneurons integrate the information • Motor output leaves the brain or ganglia via motor neurons, which trigger muscle or gland activity
Many animals have a complex nervous system which consists of: • A central nervous system (CNS) where integration takes place; this includes the brain and a nerve cord • A peripheral nervous system (PNS), which brings information into and out of the CNS
Fig. 48-3 Sensory input Integration Sensor Motor output Central nervous system (CNS) Effector Peripheral nervous system (PNS)
Neuron Structure and Function • Most of a neuron’s organelles are in the cell body • Most neurons have dendrites, highly branched extensions that receive signals from other neurons • The axon is typically a much longer extension that transmits signals to other cells at synapses • An axon joins the cell body at the axon hillock
Fig. 48-4 Dendrites Stimulus Presynaptic cell Nucleus Axon hillock Cell body Axon Synapse Synaptic terminals Postsynaptic cell Neurotransmitter
Fig. 48-4a Synapse Synaptic terminals Postsynaptic cell Neurotransmitter
A synapse is a junction between an axon and another cell • The synaptic terminal of one axon passes information across the synapse in the form of chemical messengers called neurotransmitters
Information is transmitted from a presynaptic cell (a neuron) to a postsynaptic cell (a neuron, muscle, or gland cell) • Most neurons are nourished or insulated by cells called glia
Fig. 48-5 Dendrites Axon Cell body Portion of axon 80 µm Cell bodies of overlapping neurons Sensory neuron Interneurons Motor neuron
Fig. 48-5a Dendrites Axon Cell body Sensory neuron
Fig. 48-5b Portion of axon 80 µm Cell bodies of overlapping neurons Interneurons
Fig. 48-5c 80 µm Cell bodies of overlapping neurons
Fig. 48-5d Motor neuron
Concept 48.2: Ion pumps and ion channels maintain the resting potential of a neuron • Every cell has a voltage (difference in electrical charge) across its plasma membrane called a membrane potential • Messages are transmitted as changes in membrane potential • The resting potential is the membrane potential of a neuron not sending signals
Formation of the Resting Potential • In a mammalian neuron at resting potential, the concentration of K+ is greater inside the cell, while the concentration of Na+ is greater outside the cell • Sodium-potassium pumps use the energy of ATP to maintain these K+ and Na+ gradients across the plasma membrane • These concentration gradients represent chemical potential energy
The opening of ion channels in the plasma membrane converts chemical potential to electrical potential • A neuron at resting potential contains many open K+ channels and fewer open Na+ channels; K+ diffuses out of the cell • Anions trapped inside the cell contribute to the negative charge within the neuron Animation: Resting Potential
Fig. 48-6 Key Sodium- potassium pump Na+ Potassium channel Sodium channel K+ OUTSIDE CELL [Na+] 150 mM [Cl–] 120 mM OUTSIDE CELL [K+] 5 mM [A–] 100 mM [K+] 140 mM INSIDE CELL [Na+] 15 mM [Cl–] 10 mM INSIDE CELL (a) (b)
Fig. 48-6a OUTSIDE CELL [Na+] 150 mM [Cl–] 120 mM [K+] 5 mM [A–] 100 mM [K+] 140 mM INSIDE CELL [Na+] 15 mM [Cl–] 10 mM (a)
Fig. 48-6b Key Sodium- potassium pump Na+ Potassium channel Sodium channel K+ OUTSIDE CELL INSIDE CELL (b)
Modeling of the Resting Potential • Resting potential can be modeled by an artificial membrane that separates two chambers • The concentration of KCl is higher in the inner chamber and lower in the outer chamber • K+ diffuses down its gradient to the outer chamber • Negative charge builds up in the inner chamber • At equilibrium, both the electrical and chemical gradients are balanced
Fig. 48-7 –90 mV +62 mV Inner chamber Outer chamber 150 mM 140 mM 15 mM 5 mM KCI NaCI KCI NaCI Cl– K+ Na+ Cl– Sodium channel Potassium channel (b) Membrane selectively permeable to Na+ (a) Membrane selectively permeable to K+ ( ( ) ) 5 mM 150 mM ENa = 62 mV log log = –90 mV = +62 mV EK = 62 mV 140 mM 15 mM
Fig. 48-7a –90 mV Outer chamber Inner chamber 140 mM 5 mM KCI KCI K+ Cl– Potassium channel (a) Membrane selectively permeable to K+ ) ( 5 mM log = –90 mV EK = 62 mV 140 mM
The equilibrium potential (Eion) is the membrane voltage for a particular ion at equilibrium and can be calculated using the Nernst equation: Eion = 62 mV (log[ion]outside/[ion]inside) • The equilibrium potential of K+ (EK) is negative, while the equilibrium potential of Na+ (ENa) is positive
In a resting neuron, the currents of K+ and Na+ are equal and opposite, and the resting potential across the membrane remains steady
Fig. 48-7b +62 mV 150 mM 15 mM NaCI NaCI Cl– Na+ Sodium channel (b) Membrane selectively permeable to Na+ ( ) 150 mM ENa = 62 mV = +62 mV log 15 mM
Concept 48.3: Action potentials are the signals conducted by axons • Neurons contain gated ion channels that open or close in response to stimuli
Fig. 48-8 TECHNIQUE Microelectrode Voltage recorder Reference electrode
Membrane potential changes in response to opening or closing of these channels • When gated K+ channels open, K+ diffuses out, making the inside of the cell more negative • This is hyperpolarization, an increase in magnitude of the membrane potential
Fig. 48-9 Stimuli Stimuli Strong depolarizing stimulus +50 +50 +50 Action potential 0 0 0 Membrane potential (mV) Membrane potential (mV) Membrane potential (mV) Threshold Threshold –50 –50 Threshold –50 Resting potential Resting potential Resting potential Depolarizations Hyperpolarizations –100 –100 –100 1 2 3 5 4 0 2 3 4 0 1 5 0 1 3 5 6 2 4 Time (msec) Time (msec) Time (msec) (b) Graded depolarizations (c) Action potential (a) Graded hyperpolarizations
Fig. 48-9a Stimuli +50 0 Membrane potential (mV) –50 Threshold Resting potential Hyperpolarizations –100 1 5 2 3 4 0 Time (msec) (a) Graded hyperpolarizations
Other stimuli trigger a depolarization, a reduction in the magnitude of the membrane potential • For example, depolarization occurs if gated Na+ channels open and Na+ diffuses into the cell • Graded potentials are changes in polarization where the magnitude of the change varies with the strength of the stimulus
Fig. 48-9b Stimuli +50 0 Membrane potential (mV) Threshold –50 Resting potential Depolarizations –100 0 1 5 2 3 4 Time (msec) (b) Graded depolarizations
Production of Action Potentials • Voltage-gated Na+ and K+ channels respond to a change in membrane potential • When a stimulus depolarizes the membrane, Na+ channels open, allowing Na+ to diffuse into the cell • The movement of Na+ into the cell increases the depolarization and causes even more Na+ channels to open • A strong stimulus results in a massive change in membrane voltage called an action potential
Fig. 48-9c Strong depolarizing stimulus +50 Action potential 0 Membrane potential (mV) –50 Threshold Resting potential –100 0 2 4 5 6 1 3 Time (msec) (c) Action potential
An action potential occurs if a stimulus causes the membrane voltage to cross a particular threshold • An action potential is a brief all-or-none depolarization of a neuron’s plasma membrane • Action potentials are signals that carry information along axons
Generation of Action Potentials: A Closer Look • A neuron can produce hundreds of action potentials per second • The frequency of action potentials can reflect the strength of a stimulus • An action potential can be broken down into a series of stages
Fig. 48-10-1 Key Na+ K+ +50 Action potential 3 0 Membrane potential (mV) 2 4 Threshold –50 1 1 5 Resting potential Depolarization –100 Time Extracellular fluid Sodium channel Potassium channel Plasma membrane Cytosol Inactivation loop Resting state 1
Fig. 48-10-2 Key Na+ K+ +50 Action potential 3 0 Membrane potential (mV) 2 4 Threshold –50 1 1 5 Resting potential Depolarization 2 –100 Time Extracellular fluid Sodium channel Potassium channel Plasma membrane Cytosol Inactivation loop Resting state 1
Fig. 48-10-3 Key Na+ K+ Rising phase of the action potential 3 +50 Action potential 3 0 Membrane potential (mV) 2 4 Threshold –50 1 1 5 Resting potential Depolarization 2 –100 Time Extracellular fluid Sodium channel Potassium channel Plasma membrane Cytosol Inactivation loop Resting state 1
Fig. 48-10-4 Key Na+ K+ Falling phase of the action potential 4 Rising phase of the action potential 3 +50 Action potential 3 0 Membrane potential (mV) 2 4 Threshold –50 1 1 5 Resting potential Depolarization 2 –100 Time Extracellular fluid Sodium channel Potassium channel Plasma membrane Cytosol Inactivation loop Resting state 1
Fig. 48-10-5 Key Na+ K+ Falling phase of the action potential 4 Rising phase of the action potential 3 +50 Action potential 3 0 Membrane potential (mV) 2 4 Threshold –50 1 1 5 Resting potential Depolarization 2 –100 Time Extracellular fluid Sodium channel Potassium channel Plasma membrane Cytosol Inactivation loop Undershoot 5 Resting state 1
At resting potential • Most voltage-gated Na+ and K+ channels are closed, but some K+ channels (not voltage-gated) are open