Download
1 / 20
200 likes | 289 Vues
Explore DES cluster simulations probing dark energy with galaxies, weak gravitational lensing, and more. Accessible at ccapp.osu.edu/DEScluster. Simulated images study shear, PSF correction, & radial distance effects. Discover the ClusterSTEP project, testing pipeline performance and systematic errors on simulated images. Mass estimation & halo selection in realistic N-body simulations for DES. Robust reconstruction of velocity dispersion and future plans for public involvement.

E N D
DES Cluster Simulations and the ClusterSTEP Project M.S.S. Gill (OSU / CBPF / SLAC) In collaboration with: J. Young, M.Jarvisand other DES members GREAT10 Meeting, University of Edinburgh Friday, Jan 28, 2011
Using DES simulations of 2 types: • Our analysis of a first simulated cluster • Progressing to: ClusterSTEP
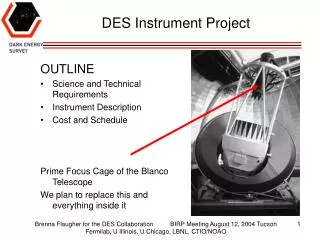
II. The Dark Energy Survey (DES) Cluster Simulations DES: Probe the nature of dark energy with • Supernovae • Baryon oscillations • Clusters of galaxies • Weak gravitational lensing
Our DES Cluster Simulation • All 62 chips are simulated (H. Lin and N. Kouropatkin) • Stepped up in increasing complexity: • Start with just background galaxies • Add in shear • Add in noise • Add in psf • Add in stars • Add in cluster and foreground galaxies Publically available to all at: ccapp.osu.edu/DEScluster (See Gill et al. 2009, arXiv:0909.3856 )
CLUSTER IMAGE INFORMATION • Truth Table Information contains: • (RA, DEC) and (x,y) pixel positions for each object • Redshift of galaxy objects • grizy Magnitudes • Theoretical shear for galaxy object positions • Image (only in one band): • Corresponds to truth rMagnitude • Theoretical shear convolved with intrinsic object ellipticity • Shear applied only for gamma < 0.2 (beyond ~400 pixels = 80” = 72 kpc for z=0.3), to avoid strong lensing regime. • Full plane radius: ~15k pixels (pixelscale=0.27”/pixel) [ Cluster simulation made by H. Lin and N. Kourapatkine at FNAL]
APPLIED CLUSTER SHEAR Input: sigma_v = 1250 km/sec pixels pixels DES Full plane: averages of truth shears in cells inside of each CCD. Each CCD is split into equally sized 8x4 cells. Same thing but close up on cluster center
SIMULATED IMAGES All images here show same part of CCD 28 – containing cluster center No Noise High Noise Low Noise Stars + Bkgd Gals Stars + Bkgd Gals Stars + Bkgd AND FrgndGals Stars + Bkgd AND FrgndGals
Screen clipping taken: 2/17/2009, 2:43 AM SIS Fits to the DES simulation Shear vs. radial distance from center in pixels After PSF correction, shear matches truth within error SExtractorellip = pink solid Truth = red solid Extracted Shear = dashed
Results: E-mode PROFILES # sigma away FILE REDSHIFT CORRECTION σv Fit Output Uncertainty TRUTH Z = 0.8 1212.7 0.8 Many 1.5 IMCAT Z = 0.8 1168 60 1 SHAPELETS [ RJM et al. ] Z = 0.8 1299 84 2 TRUTH Z = EXACT 1252.8 1.5 1 IMCAT Z = EXACT 1211 66 1.5 SHAPELETS Z = EXACT 1386 109 Using r-i>0.6 Color Cut Files z = exact z = 0.8 Low Noise File, bkgd gals picked by color
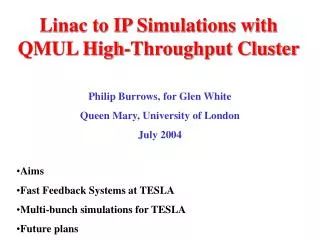
Moving to ClusterSTEP • To test results of STEP in the high shear • Regime as would be found near clusters (g>.05) • To compare performance of modern pipelines • on cluster images and see how errors in shape • measurement in different pipelines propagate • to final mass estimate • To test several systematics(e.g. PSF model, • galaxy selection) in a controlled way on • simulated images
ClusterSTEP Simulated Images • Start from R. Wechsler et al.’s full-scale N-body cosmological simulationsfor DES • Ray-traced so that shear should follow properly from realistic (NFW) cluster profiles • Resulting shear is then applied to galaxies in images
Mass of simulated halos vs. redshift Randomly selected halos from catalog of 120 most massive clusters in DC5 (Choose: away from from edge, z < 1 )
Example of shear results from full DECamplane Colored symbols are clusters (color redshift, size mass) Shear map is from truth info here This is old, get halo 2 or 6, we’ll pick just One per image, only selected ones are Good according to Matt
Typical realistic DECam focal plane PSF Here: Longest whiskers are e ~ 0.01 New ones will have higher corner PSF, with ellipticityup to 0.05, may be more complex also.
Variation of results with PSF variation IMCAT Vs. Truth Fits shown
16 Conclusions and Next Steps • Able to robustly reconstruct input velocity dispersion in initial simulation • Now moving to more realistic ClusterSTEP images with ray-tracing • Will get more robust answers for variation of cluster mass with differing observational conditions/cuts • Eventually plan to open this to public participation
SIMULATION FILES SUITE Most realistic images are in red; Noise: LN ~ 1/13 * HN
Full Field Simulation Model psf From stars (Imcat)
Individual galaxies inside the clusters Degrees (Dec) Degrees (RA)