Download
1 / 27
270 likes | 457 Vues
An Approach for Base Transit Trip Matrix Development: Sound Transit EMME/2 Model Experience. Sujay Davuluri Parsons Brinckerhoff Inc., Seattle October, 2006. Project Motivations. Need to create an accurate base transit trip matrix

E N D
An Approach for Base Transit Trip Matrix Development: Sound Transit EMME/2 Model Experience Sujay Davuluri Parsons Brinckerhoff Inc., Seattle October, 2006
Project Motivations • Need to create an accurate base transit trip matrix • Difficult to obtain such a matrix from traditional regional models • Survey data have limitations • But, ridership counts are rich and readily available
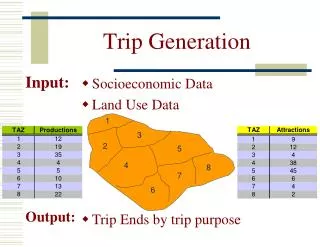
Matrix Estimation Process • Assemble/analyze key input data: • Current surveys • Transit network • Ridership counts data • Develop a seed matrix • INRO developed macro
Transit Surveys • Primary Source of User Data • Travel Patterns (O-D Estimation) • System/Route Level Planning • Consumer Feedback • Improvement of Service • Demographics Characteristics • Marketing
Types of Transit Surveys • Transit On-Board • Most Frequently Used • Self Administered • On Board/Stations/Key Transfer Points • Intercept Surveys • Personal Interviews • On Board/Stations/Key Transfer Points • Other Types • Telephone • Web Based • Mail Surveys
Limitations of Surveys • Difficulties in conducting • Significant planning required • Choosing the right methodology • Resource allocation • Low Participation Rate • Respondents lack of interest • Complex/long questionnaire • Language/literacy barriers • Large sample size to compensate
Limitation of Surveys (Cont…) • Sample Bias • Sample not representative • Coverage area not extensive • Response errors • Measurement/processing errors • Affordability • High Costs • Significant time investment • Highly detailed analysis required for OD estimation
Limitation of Surveys (Cont…) • Legal Challenges • Restrictions on certain surveys • Ban on roadside interviews in Florida • Privacy laws
Automated Passenger Counts • Automated • Relative ease in collection • Improvements in technology • Reduction in Bias • Data Quality • Richer Data than a survey • Elimination of driver involvement • Accurate load profiles for each route • Rich Data Source • Cheaper Computer Storage and Processing
Matrix Estimation • Networks • PM Peak (3 Hrs) • Off Peak (18 Hrs) • Updated to existing conditions • Model Coverage • Three County Region • Five different transit operators • Modes • Bus, Light Rail, Commuter Rail, Street Car
Matrix Estimation (Cont…) • Seed Matrix • Created originally from 1992 Survey • Separate for PM Peak & Off Peak • Filling of zero value cells • Rescale of trip length frequency from regional PSRC model • Updated with enriched data from recent surveys • Specific route level surveys • Journey to Work Data
Filling of Zero Cells • Need • Changes in transit service since 1992 • New transit lines • New transit markets • Update with new travel patterns • New opened cells given a value of 0.5
Counts • Provided by local transit agencies • Detailed counts for majority of the routes • Hourly data for a 24-hr period • Key features • Total Routes – 398 • Routes with detailed counts – 263 • Total number of count locations – 4,203 • Average counts per line – 16
Counts (Cont…) SAMPLE
Placement of Counts for ME • Multiple locations • Based on load profiles • Park & Ride demand estimation • Key features • Locations for the 263 routes – 782 • Average counts per line – 3 • Maximum count locations – 15 • Locations for the rest of 135 routes – 177
Validation • Rigorous Approach • Comparisons with Observed data • Segment level loads • Route level boardings • Line travel times • Screenlines • Average trip length • Boardings by operator
Conclusions • Matrix Estimation – a viable approach to complement survey data • Requires extensive ridership counts • Possible to match load profiles • Special analysis to create a seed matrix • Periodical update of base trip matrix • Not recommended for areas with sparse transit markets/coverage