Download
1 / 73
790 likes | 954 Vues
An alternative, birding approach to teaching sound. James de Winter birdsong@cambridgescience.co.uk. Some general sound teaching stuff begins. Frequency and Pitch. Sound is caused by vibrations. The number of vibrations every second is called the frequency .

E N D
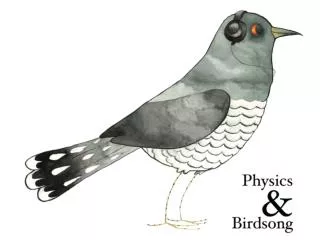
An alternative, birding approach to teaching sound James de Winter birdsong@cambridgescience.co.uk
Frequency and Pitch • Sound is caused by vibrations. • The number of vibrations every second is called the frequency. • Frequency is measured in Hertz (Hz). • 1Hz = 1 vibration every second. • 1kHz = 1000 vibrations every second. • High frequency notes are heard as high pitched sound. The higher the frequency, the higher the pitch.
How do we hear? • When something vibrates, it makes the air around it vibrate. • These vibrations are passed through the air quickly (340m/s). Sound travels quicker through solids as the particles are closer together, passing the vibrations on more quickly • The vibrating air makes our eardrum vibrate which is how we hear sound. • The air around the object making the sound does not end up in our ear, it is only the sound wave that travels to our ear. The air only moves backwards and forwards around where it was in the first place. • When the sound dies away, the air is more or less back where it started.
Speaker and candle • You can see that the air only moves backwards and forwards in the demonstration with a loudspeaker and candle flame. • As the speaker moves backwards and forwards making the sound, it makes the air move backwards and forwards. This makes the candle flame move also.
What do songs of different frequencies sound like? • TheGreat Bittern produces a sound or around a 160 vibrations a second (167Hz) • The Common Cuckoo sings a bit above 500Hz (570Hz, 520Hz) • TheCommon Sandpiper sings at about 5000Hz (4.8kHz) • The Goldcrest is about 7kHz Low Frequency High Frequency
Do notes of the same frequency always sound the same? The ‘quality’ or ‘timbre’ does matter but they do sound very similar. Can you tell the difference between the computer generated sound and the real Bittern (both at 167Hz)? And the real and digital cuckoo - a 570Hz note followed by a 520Hz Note A A B B
The frequency is the samebut that is not the whole story The ‘digital’ Cuckoo, a pure wave called a sine wave The real Cuckoo, the frequency of the note is the same as the digital one , but the wave shape is slightly different. It is this that gives the cuckoo the distinctive sound
The Human Hearing Range • Most humans can hear sounds between about 20Hz and 20,000Hz (20kHz). • As we get older, out ability to hear very high notes tends to reduce and so we may only hear up to 15kHz. • Other animals can hear different ranges, for example for dogs it is about 40Hz to 60,000Hz, mice 1000Hz to 70,000Hz and bats 20Hz to 120,000Hz.
Birds span almost the full human hearing range • Great Bittern (167Hz) • Ural Owl (370Hz) • Common Cuckoo (570Hz, 520Hz) • Little Owl (1.2kHz) • Common Redshank (2.33kHz) • Common Sandpiper (4.8kHz) • Goldcrest (7kHz) • Lesser Whitethroat (11.7– 12.3kHz) • (the first few notes are the very high ones)
The sonogram • The sonogram is a way of drawing a ‘picture’ of a sound. • It is a graph showing how the frequency of the sound changes over time. Frequency Time
The sonogram • An easy one to begin with • A note of constant frequency Frequency Time
The sonogram • An easy one to begin with • A note of constant frequency Frequency Time
The sonogram • The sonogram shows changes with time • A pulsed note of constant frequency Frequency Time
The sonogram • The sonogram shows changes with time • A pulsed note of constant frequency Frequency Time
Notes can go up as well as down • Look at the graph and imagine what the sound will be like. Frequency Time
The Willow Warbler • Listen then try and draw the sonogram Frequency Time
The Willow Warbler • Notes increasing in frequency Frequency Time
The Willow Warbler • The full sonogram is more complex but shows the same pattern
The Chiffchaff • Listen and sketch the sonogram Frequency Time
The Chiffchaff • The note is shorter and the frequency rises more quickly than the willow warbler Frequency Time
The Chiffchaff • The full analysis shows a similar but more complex pattern, rising from about 2kHz to 4kHz in a fraction of a second
The Siberian Chiffchaff Frequency Time
The Siberian Chiffchaff Frequency Time
The Siberian Chiffchaff • The full analysis shows a similar but more complex pattern
Another Chiffchaff – The Iberian Frequency Time Hint: This time think about the time between calls as well
Another Chiffchaff – The Iberian Frequency Time
A quick quiz – which is which? Red-Breasted Flycatcher Winter Wren
A quick quiz – which is which? Red-Breasted Flycatcher Winter Wren
Boys Girls Frequency Time
Frequency Time
Frequency Time
Frequency Time
Frequency Time
A G F Frequency C F Time
How do I make a sonogram? • Multiple options – Raven (Cornell Lab) • Free ‘lite’ version available if you register
Portable sonograms • There are various free of cheap Smartphone apps that will draw a sonogram (sometimes called a spectrogram) from the phone’s microphone. My picks for each platform are below • IPhone/Ipod Touch: Spectrogram Pro (around £2) (left image) • Android: Spectral Audio Analyzer Pro: (around £4 but a free version is (right image)