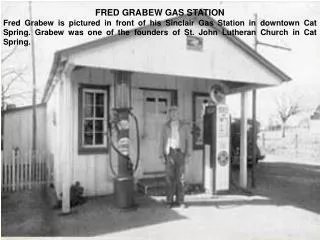
Download
1 / 70
700 likes | 836 Vues
Overview of Environmental Report for Costco Wheaton Gas Station. Conclusions. Conclusions. Based on standard EPA methods, air quality impacts are far below all EPA National Ambient Air Quality Standards

E N D
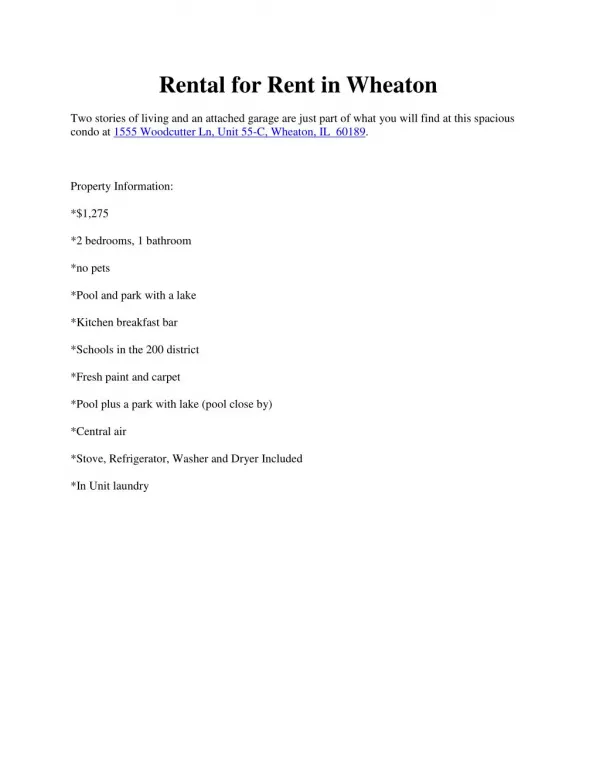
Overview of Environmental Report for Costco Wheaton Gas Station
Conclusions • Based on standard EPA methods, air quality impacts are far below all EPA National Ambient Air Quality Standards • Risks are below de minimis levels and far below reporting levels based on strict California guidelines • Noise levels are far below County requirements • Odor issues are not significant
Conclusions (Cont.) • Opponents of the gas station are basing opposition on the premise that EPA air quality standards are not sufficiently protective • Regulatory and land use decisions need to be based on objective facts and standards • Absent alternative, defined air quality standards at the County level, there is no other objective basis to evaluate air quality impacts other than consideration of published national standards and accepted guidelines for risk assessment
Conclusions (Cont.) • The impacts from the Costco gas station are low in 2013 when the station opens, and will be lower over time as enhanced motor vehicles evaporative and tailpipe controls are further incorporated into the fleet • Costco Wheaton gas station is relatively large in terms of sales but not large in terms of emissions relative to trend lines (see attached figures)
12 M Gallons / year Station with Vent Control at 99.7% in 2013 Similar to Smaller Stations in 1980s & 1990s and Will Continue to Drop • This graph was based on the best estimate of when a particular emissions control strategies would be fully enacted, usually after 10 years of having the control technology first promulgated. We took the average of the original and controlled emission rate for time periods in between the 10 year block just to keep the graphs smooth and to show that technologies were being phased in over time, which is consistent with EPA methods.
12 M Gallons / year Station with Vent Control at 99.7% in 2013 Similar to Smaller Stations in 1980s & 1990s and Will Continue to Drop Not Unprecedented: VOC emissions gasoline marketing Costco in 2013 Comparable to 1.5 M gal/year in 1987 and 3 M gal/year in 1998
12 M Gallons / year Station with Vent Control at 99.7% in 2013 Similar to Smaller Stations in 1980s & 1990s and Will Continue to Drop Not Unprecedented: VOC emissions gasoline marketing Costco in 2020 Comparable to 1.5 Mgal/year in 1997 and 3 Mgal/year in 2005
National Trends in Emissions: Downward http://www.epa.gov/airtrends/aqtrends.html
Methods and Results: Environmental Report for Costco Wheaton Gas Station
Overview of Environmental Report • All air quality impacts are within applicable national and state standards and guidelines, evaluated: • Fine particulates (PM2.5) • Carbon monoxide (CO) • Nitrogen Dioxide (NO2) • Volatile Organic Compounds (VOCs) • Odor and noise impacts minimal
Overview • Submitted initial environmental report: July 2012 • September 2012 met with Kensington Heights consultant: Dr. Henry Cole • Developed modified protocol including comments from Dr. Cole • Final report shows modeling results for Costco sources based on consensus approach • Interpretations may differ, but basis for concentrations for modeled incremental Costco sources are drawn from a common protocol
Benefit to Reviewers on Achieving Consensus of Modeling Methods • Complex modeling treatments are based on consensus methods to address incremental Costco sources • County staff and hearing examiner can focus on interpretation of results
Not Implying Consensus on All Issues • Differing interpretations of fine particulates can be supported from common modeling results • Dr. Cole requested broader scope of modeling other operations at the mall and beyond - - (but conservatively addressed through background) - - alternative background treatments can be considered based on common modeling results
Methods • Air quality analysis • Noise • Odors
Air Quality Analysis – Refinements After Initial Report July 2012 • Modeled with updated (minute-resolved) meteorological data using EPA AERMOD software (Dr. Cole Request) • Also conducted confirmatory modeling with CALPUFF dispersion model to more explicitly account for terrain effects (Dr. Cole Request) • Added “major spills” emission category (Dr. Cole request) • Increased queuing assumptions and degree of conservatism in source based on resident concerns (Costco refinement) • Increased conservatism in modeling based on assuming lower surface roughness conditions (2x increase in conservatism) (Costco refinement) • Updated vehicle emissions to account more accurately for emissions controls (Costco refinement)
Summary of Conservative Assumptions • Maximum peak traffic counts were used for all averaging times (very conservative) - - overstates (applies to Ring Road and Mall) • Assumed 90 percent of cars entering mall park at Costco lots and used peak traffic into mall for all analysis of parking lot emissions (applies to traffic going South at #16 and #20) • Used EPA conservative background method of assuming highest regional value for each averaging time occurs all the time (and corresponds with every peak modeled value) • Double counted some sources when modeling roadways and using conservative background contribution
Summary of Conservative Assumptions (Cont.) • Used very conservative (overstated) background concentrations (maximum 2009-2011) - - e.g. used 12.1 µg/m3 for annual fine particulates - -(rather than annual averages per EPA methods) • As requested, refined annual average fine particulates to 10.8 µg/m3 to more accurately represent 2013 and beyond - - overly conservative considering trend lines established by Washington Council of Governments (Requested by Parks and Planning Staff) • Increased emission factors from queuing by 2.5-fold versus previous report to resolve ambiguity (and increase conservatism) (Costco Refinement) • Increased queue lengths, which were subsequently confirmed in January 2013 study at comparable Sterling gas station (Costco refinement) • Increased roughness of surface in model (acts to increase concentrations) (Costco refinement)
Summary of Conservative Assumptions: 90 % of All Traffic to Mall Assumed to Park in Costco Lots =((79+338)-67)*0.9 =((40+185)-48)*0.9 =((30+190)-61)*0.9 =((312+57)-80)*0.9 • Assumption of 90 percent of cars entering mall parking intersections at Costco lots and use of peak traffic into mall for all analysis of parking lot emissions were clearly shown in Emission.xls spreadsheet provided to opposition - - no basis in fact for stating ignored other sources at the mall - - see Slide 58.
General Layout of Costco Sources Main Report Figure 1-5: Costco Gasoline and Warehouse Area Sources (in red)
East Side Parking Area for Costco Main Report Figure 1-6: East Parking Lot Volume Source (in red)
Layout of Gas Station Operations in Model Main Report Figure 1-4: Costco Gasoline and Warehouse Point Sources (in red)
Example of Intersection Modeling =Queue =Road Segment University Blvd Main Report Figure 1-7: Example of 18-Vehicle Traffic Queue Lengths at Nearby Road Intersections
Assumptions for Cars in Queue at Costco • Assumed 40 cars maximum 1-hour; 20 cars maximum 8-hours, and 10 cars for average over typical 15 hour operational period • Costco conducted study at Sterling (same design) January 11-12, 2013; ±7% annual sales per 2012, factored 8-hour and annual for sales difference (13.9 mm / 12 mm gallons) • Results • CO 8-hour 28% standard model; 32% if assumption refined per results • Could increase queue assumptions four-fold or higher and still not approach standards
Background Treatment • Conservatively used highest measured 2009-2011 for all modeled locations. • Overstates background relative to what would be expected in 2013. • January 2013, Parks & Planning staff requested that PM2.5 annual background be updated to more accurately reflect current conditions and to maintain compatibility with Washington Council of Government’s recommendation of 10.8 µg/m3. • By ~ 2014 when station is open, trend suggests that background will be < 10.8 µg/m3.
Treatment of Background Concentrations is a Standard Procedure in Modeling for EPA or MDE • Defined Term in EPA Guideline on Air Quality Modeling: as including: “(1) natural, (2) nearby sources other than the one(s) currently under consideration, and (3) unidentified sources.” • By way of clarification, EPA specifies that “all sources expected to cause a significant concentration gradient in the vicinity of the source or sources under consideration for emission limit(s) should be explicitly modeled” • Per above, Costco has modeled all sources with potential for causing significant gradients at the Costco gas station source: • Costco gas station operations (fueling, spillage, delivery) • Ring Road • Costco warehouse • Major nearby roadways (University, Viers Mill, Georgia Ave) • Costco parking lot and parking garage
Actual Trend in PM2.5 Measured Concentrations (Background) This figure was produced from using the raw annual average daily data from Rockville, Beltville, and Arlington accessed from: http://www.epa.gov/airquality/airdata/ad_data_daily.html. This data included all monitoring locations at each site where annual averages were computed and then a 3-year running averages was used to simulate the NAAQS. For example, the 3-year running averages for 2010 is the annual average of 2008, 2009 and 2010. Supplemental Report Figure 4.2: Trends in PM2.5 Concentrations Based on Rockville, Beltsville, and Arlington Monitoring Sites (three-year running averages from 2005 through 2012)
Actual Trend in PM2.5 Measured Concentrations (Background) Compared to NAAQS Highest by 2012 is 10.8 µg/m3 US EPA started regulating PM2.5 in 1997 where NAAQS were 15µg/m³
Annual PM2.5 Design Value Background Concentrations from Washington Council of Governments Supplemental Report Figure 4.3: Annual PM2.5 Design Value Background Concentration from Washington Council of Governments
Example Downward Trend:Three Year Running Annual Average PM2.5: Los Angeles
SEE AIR QUALITY TRENDS INTO 2013 Results
Importance of Dose: National Ambient Air Quality Standards Based on Defining Acceptable Dose • Air pollution does not create adverse health affects at all concentrations • EPA defines acceptable concentrations (dose) with a reasonable margin of safety to protect the most sensitive members of the population • Asthmatics and children are specifically identified in the Clean Air Act sensitive subpopulations to be protected • The Costco Wheaton gas station, modeled using standard EPA methods, is well below all EPA standards
Detailed Concentration Plots and Other Detailed Tables Available in Report and on Slides as Needed • Presentation presents overview for key locations: closest residence, Kenmont Swim and Tennis facility, and the Stephen Knolls School; detailed concentration aerial overlay plots are available in project reports. • Overall modeled concentrations are shown in presentation, but contributions from each source is available as needed to support discussion
Summary Table Showing Modeled Rural Concentrations at Pool and School Compared to Average Background Standards (µg/m3) Based on Conservative Rural Land Use (overstates close-in locations)
Perspective: Annual Average PM2.5Concentrations (μg/m3) Urban Concentrations (µg/m³) Rural Concentrations (µg/m³) Update to Supplemental Report Figure 3.5 based on Section 4.2 analysis of background values in the Supplemental Report.
Perspective: Maximum Predicted 8-hour CO Concentrations (μg/m3) Supplemental Report Figure 3.4: Maximum Predicted 8-hour CO Concentrations (μg/m3) for the Closest Residence, the Stephen Knolls School, and the Kenmont Swim and Tennis Center Special Receptors
Perspective: Predicted Annual Average NO2 Concentrations (μg/m3) Existing: contains a small 3-7% incremental vehicle contribution from all roads [Note: Background for Annual Average NO2 has been updated to 6.8 μg/m3 (see Section 4.0 of Supplemental Report)] Supplemental Report Figure 3.6: Predicted Annual Average NO2 Concentrations (μg/m3) for the Closest Residence, the Stephen Knolls School, and the Kenmont Swim and Tennis Center Special Receptors
Noise • Updated noise modeling to account for relocation of gas station operations • Noise levels far below County acceptable levels • Maximum modeled (LDN = 54.3 dBA) versus County Ordinance of 65 dBA and background of 53 dBA. • Maximum values below Day / Night noise thresholds
Odors • Supplemental report: 2.6% time closest homes to SSW and 4.9% SSE are upper bound estimates • Based on Sterling (without vent control at 99.7%)- - about half of fueling emissions expected in total in Wheaton with the planned controls. • Does not account for near-end of incompatibility period between on-board canister controls for vehicles and venting from vehicles to underground tank – Full Transition in MD 2-3 years • When rely exclusively with on-board canisters (expected by within several years) there will be 4x reduction from fueling emissions as compared to the Sterling odor study.
Odors (Cont.) • With vent controls (99.7%) at Wheaton station and reliance on on-board canisters in the future, odors expected to be within the Ring Road.
Perspective on Odor Analysis Wheaton/Sterling Wheaton, MD Sterling, VA Vent Gas Pumps Filling Approximate Distance from Gas Pumps / Odor Readings Hedonic Tone #1: 210 ft. \ -0.8 #2- 130 ft. \ -0.6 #3- 105 ft. \ -1.2 #4- 200 ft. \ -1.2 #5- 90 ft. \ -0.8 #6- 90 ft. \ -0.2 Approximate Distances from Gas Station Sources to Closest Home Pumping Area: 290 ft. Vent- 270 ft. Fill 1- 260 ft. Fill 2-245 ft. Fill 3- 230 ft.
Risk Assessment Most Useful as Relative Risk Comparison - - Not an Indication of Absolute Risk • CARB 10 in a million notification level is a risk management tool • For relative comparison, EPA modeling applicable for Montgomery County shows ~ 65 in a million as background risk for specific set of pollutants modeled (EPA monitoring shows 70-370 in a million for this area) • Based on urban modeling highest relative risks from Costco gas station operations is < 1 in a million
Urban VOC Annual Incremental (Emissions per protocol without considering reduction for canister controls on motor vehicles)
Urban VOC Annual Incremental (Emissions considering reduction for canister controls on motor vehicles
Opposition Positions are Not Supported By Sound Science • Ultrafine particulates • Risks at school and pool • Long-term monitoring of air quality / meteorology • Broad modeling of sources in area versus standard EPA background treatments • Alleged terrain complications • School siting guidance (CARB and EPA)