Effective Terrain Generalization and Contour Analysis for Grand Canyon Mapping
This document provides comprehensive recommendations for terrain generalization within various scales, including 24K to 1M. It discusses the processing steps for different Digital Elevation Models (DEMs), such as 10m and 30m smooth and aggregated representations. Specific strategies for hillshading adjustments are detailed using the Sky Illumination Model and blending multiple azimuths. Contour creation and analysis are highlighted, focusing on contour density and complexity across subbasins. Key examples and decisions at varying scales (24K, 50K, 250K, 500K, and 1M) are presented for clarity.

Effective Terrain Generalization and Contour Analysis for Grand Canyon Mapping
E N D
Presentation Transcript
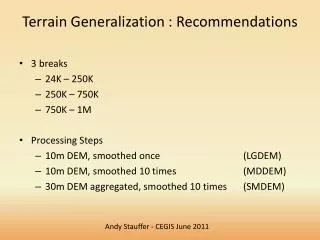
Terrain Generalization : Recommendations • 3 breaks • 24K – 250K • 250K – 750K • 750K – 1M • Processing Steps • 10m DEM, smoothed once (LGDEM) • 10m DEM, smoothed 10 times (MDDEM) • 30m DEM aggregated, smoothed 10 times (SMDEM)
Grand Canyon Rugged Terrain 24 50 100 250 500 750 1M 10-L 10-1 10-5 10-10 10-15 30-L 30-1 30-5 30-10 30-15
Close up Example of Decisions 24K 50K 250K 500K 1M
Detail X X 1M correct 1M using 24K processing
Close up Example of Decisions 24K 50K 250K 500K 1M
Close up Example of Decisions 24K 50K 250K 1M 500K
Close up Example of Decisions 24K 50K 250K 500K 1M
Adjustment to Hillshading • Sky Illumination Model hillshade (Kennelly&Stewart, 2006) • Combine multiple hillshades with different azimuths X X X X Sky Illumination Hillshade Default Hillshade
Contours : Creation Contours 100 - 250 Contours 24 - 100 LG DEM Focal Statistics MED DEM Focal Statistics 10m DEM SM DEM Aggregate Focal Statistics Contours 250 - 750 XS DEM Aggregate Contours 750 - 1M Focal Statistics
Contours : Analyzing contours • Looked at each subbasin to determine: • Contour density • Contour complexity
Contours : 250K, 25m intervals Derived from md scale DEM Derived from sm scale DEM X X
Contours : Recommendations CO WV ATL MO STL TX FL/GA UT