Download
1 / 71
730 likes | 978 Vues
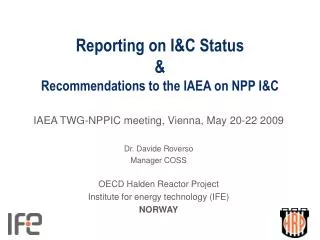
Reporting on I&C Status & Recommendations to the IAEA on NPP I&C. IAEA TWG-NPPIC meeting, Vienna, May 20-22 2009 Dr. Davide Roverso Manager COSS OECD Halden Reactor Project Institute for energy technology (IFE) NORWAY. Nuclear installations in Norway.

E N D
Reporting on I&C Status&Recommendations to the IAEA on NPP I&C IAEA TWG-NPPIC meeting, Vienna, May 20-22 2009 Dr. Davide Roverso Manager COSS OECD Halden Reactor Project Institute for energy technology (IFE) NORWAY
Nuclear installations in Norway • The Institute for energy technology, , operates two research reactors, the only nuclear installations in Norway • Halden Boiling Water Reactor (HBWR) • 20 MW, used for research on fuel and materials • High burn-up, water chemistry, stress corrosion cracking, ... • JEEP II Reactor – Kjeller • 2 MW, used for basic physics research, • Neutron source for Neutron Activation Analysis (NAA) • Nanomaterials, silisium doping, ...
NPP I&C Activities • Most NPP I&C activities at IFE are conducted as part of the OECD Halden Reactor Project (HRP) • International co-operative effort affiliated to OECD NEA in Paris • Project established in 1958 (50 years’ celebrated in 2008) • Jointly funded by its Members: • 18 countries • > 100 nuclear organisations world wide • Hosted and run by IFE, Norway • Participant types • Utilities, Vendors, Licensing Authorities and R&D centres
HRP Members • and as Associated members: • Czech Rep. - NRI • Czech Nuclear Res.Institute • France - IRSN • French Institut de Radioprotection et de Sûreté Nucléaire • Hungary - KFKI • Atomic Energy Res. Inst. • Kazakhstan – Ulba Metallurgical Plant • Russia - “TVEL” Company • Russian Research Centre “Kurchatov” • Slovakia - VUJE • Nuclear Power Plant Research Institute • USA • Westinghouse, EPRI and GE • Japan • CRIEPI, Mitsubishi and 11 utilities Signatory members: • Norway – IFE • Institutt for energiteknikk • Belgium - SCK/CEN • Belgian Nuclear Research Centre • Denmark - Risø DTU • Risø National Laboratory • Finland - Finnish Ministry of Trade and Industry • Operator VTT • France - EDF • Electricité de France • Germany - GRS • Gesellschaft für Anlagen- und Reaktorsicherheit • BMFT, Utilities (VGB), Siemens (AREVA) • Japan - JAEA • Japan Atomic Energy Agency • Korea - KAERI • Korean Atomic Energy Research Institute • Spain - CIEMAT • Spanish Centro de Investigaciones Energéticas, Medioambientales y Tecnológicas • Sweden – SSM • SSM (SKI), Swedish Radiation Safety Authority • Utilities, Westinghouse Atom • Switzerland – HSK • Swiss Federal Nuclear Safety Inspectorate • UK - Nexia Solutions (BNFL) • USA - USNRC • United States Nuclear Regulatory Commission
I&C HRP Activity Sectors • Nuclear Safety and Reliability • Operation of Halden BWR • Fuel and Materials technology research • 140 employees • Safety MTO – Man Technology and Organization • Human performance and reliability • Control room technology • Virtual Reality (VR) technology • Operator Support Systems • Software Systems Dependability • 85 employees
Home Plant Training Exploratory Study Field visits First scenario Last scenario Human Performance/Human Reliability
Innovative Human System Interfaces Task based displays Function oriented displays Ecological displays Innovative BWR displays
Computerised Operation Support Knowledge Management Simulator technology Computerised Procedures Work Processes Advanced Alarm Systems Function Allocation Performance Monitoring Core Monitoring and Simulation Condition Monitoring Prognostics Virtual Sensing
Highlights • Large-scale Signal Validation • Vision-based Diagnostics • Cable Monitoring • Mímir Framework & Toolbox • Prognostics • Recommendations to the IAEA TWG-NPPIC • HOLMUG 2009
Large-scale Signal Validation • Increase the applicability of signal validation and diagnostic tools • Method needed for supporting monitoring of a large number of signals • Signal grouping + Ensemble of models • Each model handles a small group of signals Mario Hoffmann, Giulio Gola
20-60 signals Single validation model Validated signals Hundreds of signals Single validation model Validated signals The multi-group ensemble approach ? ?
20-60 signals Single validation model Validated signals Multi-group ensemble approach Group 1 Model 1 Group generation Model aggregation Hundreds of signals Group 2 Model 2 Validated signals 1 Group K Model K 3 2 The multi-group ensemble approach Hundreds of signals Single validation model Validated signals
The multi-group ensemble approach: issues • Optimized (MOGA) • Randomized (RFSE) 1 Group generation Ensemble model 2 • Artificial Neural Networks (PEANO) • Principal Components Analysis (PCA) Ensemble aggregation • Weighted average • Simple average • Trimmed mean, Median 3
Applications 1) 84 signals from Oskarshamn BWR 2) 215 signals from Loviisa PWR 3) 920 simulated signals Forsmark-3 BWR (HAMBO)
Signal grouping: optimized; 150 groups; 8 – 147 signals 1 Validation model: PCA 2 Ensemble model aggregation: Weighted average 3 Loviisa – 215 Signals Reconstruction of signal 205 (steam temp. in condenser SD51, °C): ensemble VS single model
Ongoing work • Verification of the proposed procedure on 802 measured signals from Oskarshamn BWR • Implementation of a randomized-wrapper grouping technique • Implementation of the final grouping scheme in the PEANO signal validation system • Within 2009 Giulio Gola
Vision-Based Diagnostics Mechanical Systems Compressor Heat exchanger Electrical Systems Internal breaker connection problem. Hot fuse connection.
The Vision Application • Converts gray-scale images (with linear color palette and upper/lower temperature bounds) into temperature images • Automatic monitoring and analysis of visual/thermographic images/segments and detection of anomalies compared to previous snapshots • Image augmentation to visualize when crossing pre-determined thresholds • Upon anomaly detection, initiates image sequence recording • Image sequence playback
Tests at the Halden Reactor Thermographic observation of valve heating up:
Tests at the Halden Reactor cont. Index 42 - Upper average intensity limit reached for segment 'Valve_02' Index 54 - Upper relative fraction limit reached for segment 'Valve_02' Index 57 - Upper average intensity limit reached for image Temperature Time index
Tests at the Halden Reactor Index 29 - Upper relative fraction limit reached for segment 'SteamBoxThermo' Index 30 - Upper threshold fraction limit reached for image Index 33 - Upper average intensity limit reached for segment 'SteamBoxThermo' Index 35 - Upper average intensity limit reached for image Temperature Time index
Cable Monitoring • LIRA (LIne Resonance Analysis) as a Cable Analyzer • Local degradation detection and localization • Thermal degradation • Mechanical damage • Gamma irradiation damage • Global degradation assessment and residual life estimation • Thermal degradation • Gamma irradiation degradation • Harsh environment Paolo Fantoni
Local degradation detection with LIRA Based on discontinuities of the characteristic impedance caused by mechanical or thermal degradation Sensitive to very small electric properties change (5pF/m for 0.3m in the picture) Localization error average less than 0.3% of total length Hotspot at 50m ΔP
Comparison Tests (Tecnatom) • Compared Techniques • Line Resonance Analysis (LIRA) • Elongation at Break (EAB) • Time-Domain Reflectometry (TDR) • Insulation Resistance (IR) LIRA TDR
LIRA - Localization Accuracy AVGERR= 0.23 % of cable length STD = 0.08%
Global degradation assessment 3 EPR samples, 20 m long, were aged at 140 °C for 10, 20 and 30 days, producing a thermal degradation equivalent to 20, 40 and 60 years Developed and tested two measures CBAC: Central Band Attenuation for Capacitance CBAL: Central Band Attenuation for Inductance Newcable 20 years equivalent 40 years equivalent 60 years equivalent
EAB/CBAC Correlation, EPR (TECNATOM) new 20 years Elongation At Break 40 years 60 years CBAC LIRA Global degradation measure
Intelligence Pattern Classification Regression Estimation Hypothesis Testing Uncertainty Estimation RiskOptimisation Pattern Classification Regression Estimation Hypothesis Testing Uncertainty Estimation RiskOptimization Knowledge Input Selection Data Clustering Statistical Analysis Modelling Performance Analysis External Tools (e.g. SAS) Input Selection Data Clustering Statistical Analysis Modeling Performance Analysis External Tools (e.g. SAS) Information Data Conditioning Data Filtering Feature Extraction Data Normalization Data Conditioning Data Filtering Feature Extraction Data Normalization Data Input Data Input Data Mímir Data Validation, Reconstruction, andCalibration Monitoring Early Fault Detection and Diagnostics ... Lifetime and Performance Prediction Pattern Classification Regression Estimation Hypothesis Testing Uncertainty Estimation RiskOptimization Input Selection Data Clustering Statistical Analysis Modeling Performance Analysis External Tools (e.g. SAS) Data Conditioning Data Filtering Feature Extraction Data Normalization . . . Data Input TOOLBOX
Signal Grouping Signal grouping for large scale applications through the use of Random Feature Selection Ensemble aladdin Performs early fault detection and diagnosis through the dynamic recognition of observable changes in measurement signals PEANO A system for Signal Validation and On-line Calibration Monitoring based on auto-associative empirical models Virtual Sensing Empirical Ensemble-Based Virtual Sensing using regression models to estimate quantities not directly measured with physical instruments Why Mímir
Mìmir … Wavelet Filtering Clustering Genetic Algorithms … … Filtering Feature Selection Regression Model Classification … … Normalisation Neural Network Ensembles … Why Mímir Filtering Ensembles Clustering Filtering Filtering Genetic Algorithms Ensembles Feature Selection Normalisation Ensembles Normalisation Normalisation Classification Neural Network Regression Model Neural Network Regression Model
Intelligence Regression Estimation Regression Estimation Regression Estimation Knowledge Information Data Filtering Data Filtering Data Filtering Data Mímir Data Validation, Reconstruction, andCalibration Monitoring Data Validation, Reconstruction, andCalibration Monitoring Early Fault Detection and Diagnostics … Lifetime and Performance Prediction Pattern Classification Hypothesis Testing Uncertainty Estimation RiskOptimisation Pattern Classification Hypothesis Testing Uncertainty Estimation RiskOptimisation Regression Estimation Pattern Classification Hypothesis Testing Uncertainty Estimation RiskOptimisation Input Selection Data Clustering Statistical Analysis Modelling Performance Analysis External Tools (e.g. SAS) Data Clustering Input Selection Data Clustering Statistical Analysis Modelling Performance Analysis External Tools (e.g. SAS) Input Selection Data Clustering Statistical Analysis Modelling Performance Analysis External Tools (e.g. SAS) Data Normalization Data Conditioning Feature Extraction Data Normalization . . . Data Conditioning Feature Extraction Data Normalization Data Filtering Data Conditioning Feature Extraction Data Normalization TOOLBOX Data Input Data Input Data Input Data Input
Industry Standards • ISO-13374 • Condition monitoring and diagnostics of machines – Data processing, communication and presentation • MIMOSA OSA-CBM • Open System Architecture for Condition-based Maintenance (OSA-CBM) • Implementation of ISO-13374 • A standard architecture for moving information in a condition-based maintenance system • Mìmir • Is being designed to be compliant with ISO-13374 and the MIMOSA OSA-CBM specification
ISO-13374 and Mimosa’s OSA-CBM External systems, data archiving, and block configuration Advisory Generation (AG) Technical displays and information presentation Prognostics Assessment (PA) Health Assessment (HA) State Detection (SD) Data Manipulation (DM) Data Acquisition (DA) Sensor / Transducer / Manual entry
Mímir Demonstrator • Version 1 • Based on Java Plug-in Framework • October 2008 • Version 2 • Based on OSA-CBM Modular Implementation Framework • Penn State University, Applied Research Lab (ARL) • U.S. Army Logistics Innovation Agency (USALIA)
Example Case Study Signal Validation of 14 Signals from Oskarshamn O-3
Example Case Study Signal Validation of 14 Signals from Oskarshamn O-3
Signal Validation in a Nutshell PlantSignals SignalValidation Validated Signals Plant Signals Validated Signals EstimateSignals SignalHealth Assessment Residual Calculation
Intelligence Knowledge Information Data Mímir ... Pattern Classification Regression Estimation Hypothesis Testing Uncertainty Estimation RiskOptimization PCA Estimation Pattern Classification Uncertainty Estimation Hypothesis Testing RiskOptimisation SPRT Pattern Classification Regression Estimation Uncertainty Estimation RiskOptimization Input Selection Data Clustering Statistical Analysis Modeling Performance Analysis External Tools (e.g. SAS) Input Selection Data Clustering Statistical Analysis Performance Analysis External Tools (e.g. SAS) Modelling Input Selection Data Clustering Statistical Analysis Performance Analysis External Tools (e.g. SAS) Modeling Data Conditioning Data Filtering Feature Extraction Data Normalization . . . STD Normalization Data Conditioning Data Filtering Feature Extraction Data Conditioning Data Filtering Feature Extraction Data Normalization Data Input Data Input Data Input TOOLBOX
Test_1 Test_2 Test_3 PCA AANN SPRT σ-2σFixedBound C# Matlab Fortran Java Signal Validation in Mímir - Simple Set-up Advisory Generation (AG) Prognostics Assessment (PA) I/O Display Health Assessment (HA) DataDisplay State Detection (SD) TrendGraph NormaliseSTD DenormaliseSTD Data Manipulation (DM) I/O Data Feeder Data Acquisition (DA)
Case Tests • Test 1 – Signal Offset • PCA Reconstruction • AANN Reconstruction • PEANO Reconstruction • σ-2σ Fixed Bounds Signal Health Assessment (on PCA residual) • SPRT Signal Health Assessment (on PCA residual) • Test 2 - Signal drift • PCA Reconstruction • AANN Reconstruction • PEANO Reconstruction • σ-2σ Fixed Bounds Signal Health Assessment (on PCA residual) • SPRT Signal Health Assessment (on PCA residual)
Test_1 Test_2 Test_3 C# Matlab Fortran Java Signal Validation in Mímir – Simple Set-up SPRT I/O Display Health Assessment (HA) DataDisplay σ-2σFixedBound TrendGraph PCA NormaliseSTD DenormaliseSTD Data Manipulation (DM) AANN I/O Data Feeder Data Acquisition (DA)