Download
1 / 1
20 likes | 272 Vues
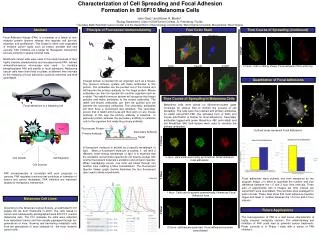
Characterization of Cell Spreading and Focal Adhesion Formation in B16F10 Melanoma Cells. Composite. Nucleus. Paxillin. pY397. Actin. Quantitation of Focal Adhesions. Focal adhesions in a migrating cell. pY397. Paxillin. Fluorescent Protein. 1. Graf. Cas. Secondary Antibody.

E N D
Characterization of Cell Spreading and Focal Adhesion Formation in B16F10 Melanoma Cells Composite Nucleus Paxillin pY397 Actin Quantitation of Focal Adhesions Focal adhesions in a migrating cell pY397 Paxillin Fluorescent Protein 1 Graf Cas Secondary Antibody FAK Kinase Primary Antibody Grb2 Target FERM FAT ASAP1 PI3K Talin GFRs PLC Cell Growth Cell Migration Cell Survival John Ganz1 and Karen H. Martin2 1Biology Department, Class of 2009 Eckerd College, St. Petersburg, Florida 2 The Mary Babb Randolph Cancer Center and the Department of Neurobiology and Anatomy, West Virginia University, Morgantown, West Virginia Abstract Principle of Fluorescent Immunostaining Four Color Stain Time Course of Spreading (Continued) Focal Adhesion Kinase (FAK) is a member of a family of non-receptor protein tyrosine kinases that regulate cell survival, migration and proliferation. This kinase is often over expressed in invasive cancer types such as breast, prostate and skin cancers. FAK inhibitors are a target for therapeutic intervention and are currently in phase I clinical trials. Melanoma cancer cells were used in this study because of their highly invasive characteristics and increased levels FAK. Indirect immunofluoresence microscopy was used to visualize phosphorylated FAK and paxillin in focal adhesions. Melanoma cancer cells were then fixed on plates at different time intervals so the maturing of focal adhesions could be observed and then quantitated. 3 Hour 3 Hour 3 hours- Cell in oblong shape. Focal adhesion thick and long A target protein is injected into an organism such as a mouse. The mouse’s immune system will make antibodies to this protein. The antibodies are the purified out of the mouse and will become the primary antibody for the target protein. Mouse antibodies can then be injected into another organism such as a rabbit. The rabbit’s immune system will recognize the foreign proteins and make antibodies to the mouse antibodies. The rabbit anti-mouse antibodies can then be purified and will become the secondary antibodies. The secondary antibodies will then have a fluorescent dye attached. The secondary protein that is rabbit anti-mouse will then work on any mouse antibody. In this way the primary antibody is selective to particular protein whereas the secondary antibody is selective only to the organism that made the primary antibody. Time Course of Spreading In Melanoma Cells Melanoma cells were plated on fibronectin-coated glass coverslips for various time to monitor the process of cell spreading. The cells were then stained with primary antibodies for rabbit anti-pY397 FAK (the activated form of FAK) and mouse anti-Paxillin (a marker for focal adhesions). Secondary antibodies tagged with green AlexaFluor 488 (anti-rabbit) and red AlexaFlour 546 (anti-mouse) were used to visualize the primary antibodies. Outlined areas represent Focal Adhesions 1/2 Hour A fluorescent molecule is excited by a specific wavelength of light. When a fluorescent molecule is excited, it will emit a different, lower-energy wavelength of light. It is essential that the excitation and emission spectra do not heavily overlap with another fluorescent molecule’s excitation and emission spectra. When overlapping occurs, one color will bleed through into another color creating a false colocalization. The Fluorescent Spectra Viewer graph (below) illustrates the four fluorescent dyes used in these experiments. ½ hour- cells small and mostly symmetrical. Small immature focal adhesions FAK overexpression is correlated with poor prognosis in cancers. FAK regulates functions that contribute to formation of tumors and cancer metastasis. FAK inhibitors are important targets for therapeutic intervention. 1 Hour Focal adhesions were outlined and then measured by the program Image J in effort to quanitate the number and size difference between the 1.5 and 3 hour time intervals. Three sets of experiments with 3 images per time interval per experiment were quantitated. The raw data were averaged for each interval. These data show that focal adhesions become larger and fewer in number between the 1.5 hour and 3 hour interval. 1 Hour- Cells start to spread symmetrically. Numerous Focal Adhesion form. Melanoma Cell Lines According to the American Cancer Society, an estimated 8,110 people will die from melanoma in 2007. The cells raised in culture and subsequently photographed were B16 F10 murine melanoma cells. The F10 indicates the cells were collected from metastatic tumors and then serially passaged through ten generations of mice. Growing and harvesting metastatic cells from ten generations of mice selected for the most invasive cancer cells. Future Applications 2 Hour The overexpression of FAK is a well known characteristic of highly invasive/ metastatic cancers. The understanding and inhibition of FAK could lead to powerful cancer treatments. Pfizer currently is in Phase I trials with a series of FAK inhibitors. 2 hours- cell become polarized. Focal adhesions become consolidated