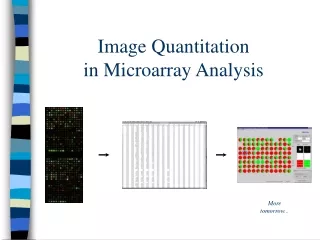
DNA Quantitation
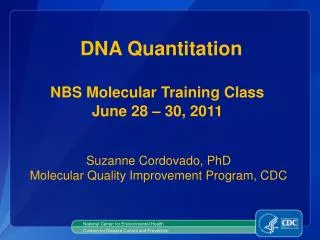
NBS Molecular Training Class June 28 – 30, 2011. DNA Quantitation. Suzanne Cordovado, PhD Molecular Quality Improvement Program, CDC. National Center for Environmental Health. Centers for Disease Control and Prevention. DBS DNA Quantitation : When and How?.

DNA Quantitation
E N D
Presentation Transcript
NBS Molecular Training ClassJune 28 – 30, 2011 DNA Quantitation Suzanne Cordovado, PhD Molecular Quality Improvement Program, CDC National Center for Environmental Health Centers for Disease Control and Prevention
DBS DNA Quantitation: When and How? • Typically unnecessary for routine PCR based assays • Important for validating new assay limits and sensitivity • Too little DNA may lead to allele drop-out (not always obvious) • Some assays require a minimum DNA quantity
DBS DNA Quantitation: When and How cont. • Absorbance • Measure not specific to DNA • DBS DNA contains contaminants resulting in inaccurate measures • Not recommended for DBS DNA • Pico-green • Measure specific to double stranded DNA • Recommended for DBS DNA • Quantitative PCR • Measure specific to amplifiable DNA • PCR inhibitors may underestimate DNA concentration • Different genomic targets may give different concentrations • Recommended for DBS DNA
DNA Quantitation: Absorbance • DNA absorbs UV light at 260nm • Spectrophotometer reads the amount of light that passes through the sample to determine the amount of DNA present • Disadvantage: cannot distinguish between dsDNA, ssDNA, RNA or aromatic organic compounds • Proteins absorb UV light near 280nm • A sample with little protein contamination will have A260/280 ratio of 1.8.
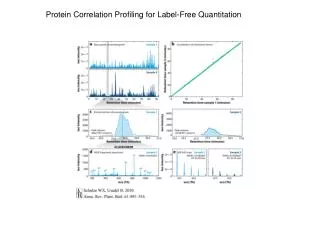
DNA Quantitation: Picogreen • Fluorescent dye binds to dsDNA • Absorbs light at 480nm (blue) and emits light at 520nm (green) • Using a known standard curve, the amount of light emitted can be used to calculate DNA quantity • Unincorporated dye does not absorb light at 480nm • Contaminants typically do not impact this measure
DNA Quantitation: quantitative PCR DNA florescence is measured during each cycle of amplification which is used to calculate quantity. The fluorescent labeled probe anneals to the genomic DNA. The label is not visible prior to amplification. Taq reporter Taq polymerase begins to synthesize the new DNA strand. Once the enzyme encounters the probe, the exonuclease activity of the Taq will degrade the probe allowing visualization of the label. quencher
qPCR: RNaseP Amplification Plot Unknown (~4 ng/µL) Unknown (~0.27 ng/µL) Unknown (~10.8 ng/µL) Unknown (~3 ng/µL) • Standard curve amplification – 8 points, each run in duplicate (pink curves) • Unknown sample amplification – 4 samples, each run in duplicate (blue curves)
DBS DNA Extraction Evaluation Decision Tree • Evaluate DNA quantitation methods • Spectrophotometer (Nanodrop) • Picogreen • qPCRRNase P • Evaluate qPCR standard curve sources • Pooled genomic DNA • Lymphocyte DNA • Plasmid DNA
DBS DNA Extraction Evaluation Decision Tree Partners Public Health Collaborators: California, Massachusetts, New York, Texas, Washington, Wisconsin and CDC
Average DNA Concentration from 20 Newborn DBS Concentration – ng/ul DBS DNA Extraction by Method, and Age of Spot /Storage Conditions Picogreen and qPCR using RNAseP (genomic DNA standard curve) were most similar
Average DNA Concentration from 20 Newborn DBS Methods: PicoGreen, qPCR, and Spectrophotometry
DNA Quantitation Conclusions • Spectrophotometry overestimates the quantity of DNA extracted from a DBS • qPCRand PicoGreen DNA quantitation methods gave similar results and were consistent with the expected outcome