Download
1 / 42
560 likes | 1.04k Vues
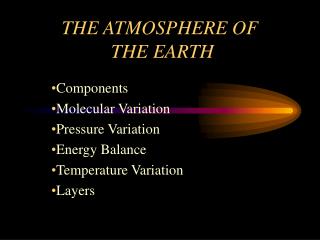
Earth’s Atmosphere with focus on the upper atmosphere – above 100km (Thermosphere and Ionosphere). Gang Lu High Latitude Observatory National Center for Atmospheric Research. 2007 Summer School for REU. Outline. Atmospheric Layers The Thermosphere & Ionosphere

E N D
Earth’s Atmospherewith focus on the upper atmosphere – above 100km(Thermosphere and Ionosphere) Gang LuHigh Latitude ObservatoryNational Center for Atmospheric Research 2007 Summer School for REU
Outline • Atmospheric Layers • The Thermosphere & Ionosphere • Electrodynamical Processes in the Ionosphere • Storm Impacts on the Upper Atmosphere • Homework Problems
Atmospheric Distribution under Hydrostatic Equilibrium z is altitude g(z) is the acceleration of gravity ris mass density Pressure gradient: For perfect gas approximation: k = Boltzmann’s constant M = mean mass of the molecules Combining the above 2 equations yields: is the scale height If H does not vary with altitude z:
Atmospheric Density Distribution Mixed atmosphere (below ~100 km): M is the mean molecular weight of atmospheric gases Diffusively separating atmosphere (above ~100 km): mi is the molecular weight of individual species If T, M, and g are not functions of z: Each species has its own scale height.
Column Density Total Electron Content: 1 TEC Unit = 1012 electron/cm2 If H is independent of altitude: Column Density: the number of molecules per unit area in a column above z0:
Ionospheric Regions Solar Min and Max Distributions
Ionospheric Regions Day and Night Distributions
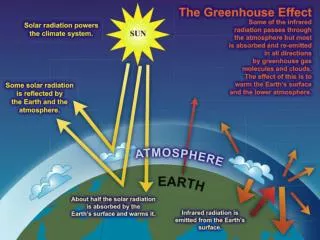
Sources of Ionization Solar EUV and X-rays Galactic Cosmic Rays Courtesy of Scot Elkington
Altitude Attenuation of Solar Irradiance Thermosphere Mesosphere Stratosphere Troposphere
Ionization Rate (cm-3 sec-1) Solar Minimum Solar Maximum Courtesy of Stan Solomon
Principal Chemical Processes in the Thermosphere and Ionosphere Conversion: N2++O[NO++ O N2 + O+[NO++O Photoionization: hu+O [ O+ + e- hu+ O2[O2++ e- hu+ N2[N2+ + e- Recombination: O+O + N2[O2+ N2 Collisional Ionization: e-+O[O++2e- Dissociative Recombination: O2++e-[O + O N2+ + e-[N+N NO++e-[N + O Charge Exchange: H+O+[H++ O O2+O+[O2++ O N2+O+[N2++ O Radiative Recombination: O++e-[hu+ O
Electrodynamic Processes In the Ionospere
Horizontal Current: Pedersen Current Hall Current Ionospheric Currents where SP = height integrated Pedersen conductivity SH = height integrated Hall conductivity
Field-aligned Current: Region 1 currents Region 2 currents Ionospheric Currents Horizontal Current: JH JP
Energy Transfer to the Ionosphere For static conditions, the Poynting’s theorem reduces to: magnetic energy mechanical or thermal energy mechanical energy magnetic energy Poynting’s Theorem: where
Electromagnetic Energy Dissipation: Joule heating When neutral wind is neglected: When neutral wind is included: plasma drift velocity neutral wind velocity Energy Transfer to the Ionosphere Horizontal Current: (Ohm’s Law)
Solar and Magnetospheric Energy Budget Solar irradiance: 1017 W (with 0.1% variability) Solar wind kinetic power: 1013~1014 W Magnetospheric power: 1011~1013 W • Auroral precipitation: 109~1011 W • Joule heating rate: 1010~1012 W • Ring current injection: 1010~1012 W • Plasma sheet heating: ~1011 W • Plasmoid ejections: 1010~1011 W Power consumed by US: ~8x10¹¹ W • Energy input to the magnetosphere: 1016~1018 Joules • Energy released by a typical CME: 1024 Joules • Mass input into the magnetosphere: 105~106 kg • Mass released by typical CME: 2~5x10¹² kg
Solar Flare Effects on the thermosphere and Ionosphere
Electron Density at ~110 km During Flare on 9/7/2005 1720UT 1730UT Flare onset 1740UT 1750UT 3x105 cm-3 1x10³ 1800UT 1810UT 1820UT 1830UT 3x105 cm-3 1x10³ 1840UT 1850UT 1900UT 1910UT 3x105 cm-3 1x10³
Neutral Temperature Change at ~350 km During Flare 1720UT 1730UT Flare onset 1740UT 1750UT 100 oK 0 1800UT 1810UT 1820UT 1830UT 100 oK 0 1850UT 1910UT 2000UT 2200UT 100 oK 0
Solar Energetic Proton Effects on the Upper Atmosphere
% Change of Electron Density due to SEPs SouthernPolar Cap Northern Polar Cap October 27 – November 5, 2003 October 27 – November 5, 2003
Changes of NOX (NO+NO2) and Ozone due to SEPs Northern Polar Cap Southern Polar Cap NOX NOX O3 O3 October 27 – December 31, 2003 October 27 – December 31, 2003
Effects of Magnetospheric Energy Inpout on the Upper Atmosphere
TIEGCM Difference TEC Maps During Storm 1700UT 1730UT 1800UT 1600UT 8 0 -8 1830UT 1900UT 1930UT 2000UT 8 0 -8 2030UT 2100UT 2130UT 2230UT 8 0 -8
TIEGCM Difference O/N2 Ratio During Storm 1700UT 1730UT 1800UT 0.5 1600UT 0 -0.5 1830UT 1900UT 1930UT 2000UT 0.5 0 -0.5 2030UT 2100UT 2130UT 2230UT 0.5 0 -0.5
Neutral Temperature Change at ~350 km During Storm 1610UT 1620UT 1630UT 1640UT 300 Kelven 0 1710UT 1730UT 1750UT 1820UT 300 Kelven 0 1900UT 1940UT 2100UT 2130UT 300 Kelven 0
Neutral Temperature Change at ~350km During Flare on Sep. 7 During Storm on Sep. 10 100 300 DTNOK DTNOK 0 0
Homework Problem 1: • Name the layers 1 to 4 • Identify the curves A, B, C and D
Homework Problem 2: If the neutral temperature at 300 km is increases from 1300 oK to 1500 oK during a solar flare event, will the neutral number density at 300 km increase or decrease? Assuming the thermosphere is mainly composed of atomic oxygen.
Homework Problem 3: When neutral wind is neglected, Joule heating QJH is simply expressed as: Rewrite the full expression for Joule heating in the reference frame of neutral wind . Do neutral winds contribute positively or negatively to Joule heating? (Hint: replacing with , where )
Distorted Magnetic Field Dipole Magnetic Field
x Magnetic Reconnection &Circulation
High-Latitude Ionosphere Solar wind Equatorial Plane Dawn 60° Open-Closed Boundary Midnight Noon Flow lines Dusk Noon-Midnight Meridional Plane Magnetospheric Topology & Plasma Convection Magnetopause Bow Shock