Download
1 / 38
380 likes | 490 Vues
This presentation by Dr. Christina Reith from the University of Oxford explores the implications of lowering LDL cholesterol in non-renal and renal disease patients based on the results of the SHARP trial. The study design, main results, and conclusions from the Cholesterol Treatment Trialists Collaboration meta-analysis are discussed. The interplay between heart and kidney health, arterial health, and cardiovascular risk factors are also highlighted.

E N D
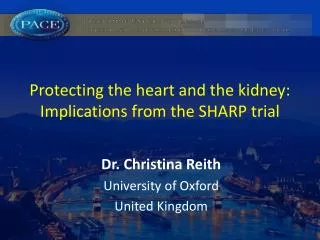
Protecting the heart and the kidney:Implications from the SHARP trial Dr. Christina Reith University of Oxford United Kingdom
Outline of presentation Lowering LDL cholesterol in non-renal patients Lowering LDL cholesterol in renal disease Study design of SHARP Main results of SHARP Conclusions
Cholesterol Treatment Trialists(CTT) Collaboration CTT Collaboration Lancet2010 • Collaborative meta-analysis of individual participant data from randomized trials of LDL-cholesterol (LDL-C) lowering therapy • Allows detailed analyses of effects of statins: • Efficacy outcomes: Major vascular events (major coronary events, stroke, or coronary revascularization); vascular mortality • Safety outcomes: Cancer (site-specific); non-vascular mortality • Major subgroups: Efficacy and safety in different types of patients (eg, by baseline LDL cholesterol, or by stage of kidney disease) • By follow-up time (eg, with more prolonged treatment) • Current cycle: • 21 trials of statin versus control • 5 trials of more versus less intensive statin • 24,000 major vascular events among 170,000 participants
More vs. Less (5 trials) CTT meta analysis: Proportional reduction in MAJOR VASCULAR EVENTS versus absolute LDL-C reduction 30% 25% Statin vs. control (21 trials) 20% Proportional reduction in vascular event rate (95% CI) 15% 22% (20%-24%) risk reduction per 1 mmol/L (39mg/dL) P<0.0001 10% 5% 0% 0.0 20 40 Mean LDL cholesterol difference between treatment groups (mg/dL) CTT Collaboration Lancet2010
CTT: Similar relative reductions in MVE risk per 40 mg/dL LDL-C reduction, irrespective of presenting LDL-C No. of events (% pa) Presenting LDL-C (mg/dL) Relative risk (CI) More statin Less statin 704 (4.6) 795 (5.2) 0.71 (0.52 - 0.98) < 80 ³ 1317 (4.8) 80 <100 1189 (4.2) 0.77 (0.64 - 0.94) ³ 1065 (4.5) 1203 (5.0) 0.81 (0.67 - 0.97) 100 <120 ³ 517 (4.5) 633 (5.8) 0.61 (0.46 - 0.81) 120 <140 ³ 0.64 (0.47 - 0.86) 303 (5.7) 398 (7.8) 140 3837 (4.5) 4416 (5.3) 0.72 (0.66 - 0.78) Total 0.5 1 1.5 0.75 1.25 More statin Less statin Trend test: 2 on 1 df = 2.04 ; p=0.2 better better CTT Collaboration Lancet 2010
Arteries Atherosclerosis Increased wall thickness Arterial stiffness Endothelial dysfunction Arterial calcification Systolic hypertension Cardio-renal phenotype: Reasons the effects of LDL-lowering may differ in CKD patients Heart • Structural disease (ie, ventricular re-modelling) • Ultrastructural disease (ie, myocyte hypertrophy and capillary reduction) • Reduced left ventricular function • Valvular diseases (hyper-calcific mitral/aortic sclerosis or stenosis) • Conduction defects and arrhythmias
Dialysis patients: minority ofvascular deaths are atherosclerotic 27% USRDS 2005 Annual Data Report
CTT: Previous lack of evidence for reduction in MVE risk in people with eGFR below 30 mL/min/1.73m2 No. of events Estimated GFR (mL/min/1.73m2) Relative risk (CI) Statin Control 0.82 (0.44 - 1.55) 46 (4.8%) 43 (6.1%) < 30 313 (4.7%) 393 (6.0%) 0.77 (0.65 - 0.93) ³30 < 45 ³45 < 60 1154 (3.9%) 1480 (5.1%) 0.79 (0.72 - 0.86) ³60 < 90 3416 (3.2%) 4244 (4.1%) 0.80 (0.76 - 0.84) ³90 671 (2.9%) 915 (4.1%) 0.73 (0.65 - 0.82) 5802 (3.1%) 7344 (4.0%) 0.78 (0.76 - 0.81) Total 99% or 95% CI 1 0.4 0.6 0.8 1.2 1.4 Control/less better Statin/more better Trend test: 2 on 1 df = 0.61 ; p=0.43 CTT Collaboration Lancet 2010
4D trial: Inconclusive evidence about the benefits of statin therapy in CKD patients RR 0.92 (95% CI 0.77 to 1.10); P=0.37 Wanner et al N Engl J Med 2005
AURORA trial: Inconclusive evidence about the benefits of statin therapy in CKD patients RR 0.96; 95% CI 0.84 to 1.11; P = 0.59 Fellstrom et al N Engl J Med 2009
SHARP designed to fill a gap in the evidence on lowering LDL-C in CKD patients • Does LDL-lowering therapy reduce risk of atherosclerotic disease in CKD patients? • Exclusion of CKD patients from most statin trials • Previous statin trials in CKD patients inconclusive • Can such a reduction be achieved safely? • Concerns about safety of statins in CKD patients • Combination of ezetimibe with moderate statin dose intended to minimize side-effects
LDL lowering regimen in SHARP CTT indicated that relative benefit likely to be proportional to absolute LDL reduction Patients with CKD have average or below average LDL cholesterol (unless nephrotic) To maximise benefit, need intensive LDL lowering regimen in CKD BUT, high-dose statins NOT SAFE in CKD SHARP used simvastatin 20mg plus ezetimibe 10mg
SHARP: Sensitive to potential benefits • Emphasis on detecting effects on ATHEROSCLEROTIC outcomes • INCLUSION of coronary and non-coronary revascularization procedures • EXCLUSION of hemorrhagic stroke and non-coronary cardiac death from key outcome
SHARP: Wide inclusion criteria • History of chronic kidney disease (CKD) • Not on dialysis: elevated creatinine on 2 occasions • Men: ≥1.7 mg/dL (150 µmol/L) • Women: ≥1.5 mg/dL (130 µmol/L) • On dialysis: hemodialysis or peritoneal dialysis • Age ≥40 years • No history of myocardial infarction or coronary revascularization
SHARP: Study Design 11,792 Screened 6-week placebo run-in 9,438 Randomized 4,193Eze/Simva 4,191Placebo 1,054 Simvastatin 1 year 886 re-randomized + 429 + 457 • Effects of ezetimibe on: • Safety outcomes • Lipid profile 4,650 Eze/Simva10/20 mg 4,620Placebo Median follow-up = 4.9 years Main analyses of safety and efficacy
Renal status at randomization • *eGFR in mL/min/1.73m2
Impact of net compliance with study treatment on achieved LDL-C differences during the trial Net compliance is defined as the difference between groups in the proportion that were taking at least 80% of study treatment or a non-study statin
SHARP: Muscle safety ITT = randomised “intention-to-treat” comparison *Myopathy defined as CK > 10 x ULN with muscle symptoms †Rhabdomyolysis defined as myopathy with CK > 40 x ULN
SHARP: Cancer incidence 25 20 Risk ratio 0.99 (0.87-1.13) Logrank 2P=0.89 15 Proportion suffering event (%) eze/simva placebo 10 5 0 0 1 2 3 4 5 Years of follow-up
No beneficial (or adverse) effect on pre-specified renal outcomes Event eze/simva placebo Risk ratio & 95% CI (n=3117) (n=3130) Main renal outcome End-stage renal disease 1057 (33.9%) 1084 (34.6%) 0.97 (0.89-1.05) Tertiary renal outcomes ESRD or death 1477 (47.4%) 1513 (48.3%) 0.97 (0.90-1.04) ESRD or 2 x creatinine 1190 (38.2%) 1257 (40.2%) 0.93 (0.86-1.01) 0.6 0.8 1.0 1.2 1.4 eze/simva better placebo better
Key outcome: Major Atherosclerotic Events 25 20 Risk ratio 0.83 (0.74-0.94) Logrank 2P=0.0021 placebo 15 eze/simva Proportion suffering event (%) 10 5 0 0 1 2 3 4 5 Years of follow-up
Benefit for both MAEs and MVEs Event eze/simva placebo Risk ratio & 95% CI (n=4650) (n=4620) Major coronary event 213 (4.6%) 230 (5.0%) Non-hemorrhagic stroke 131 (2.8%) 174 (3.8%) Any revascularization procedure 284 (6.1%) 352 (7.6%) 0.83 (0.74-0.94) Major Atherosclerotic Event 526 (11.3%) 619 (13.4%) p=0.0021 Other cardiac death 162 (3.5%) 182 (3.9%) Hemorrhagic stroke 45 (1.0%) 37 (0.8%) Other Major Vascular Events 207 (4.5%) 218 (4.7%) 0.94 (0.78-1.14) p=0.56 Major Vascular Event 701 (15.1%) 814 (17.6%) 0.85 (0.77-0.94) p=0.0012 0.6 0.8 1.0 1.2 1.4 eze/simva better placebo better
SHARP consistent with 4d and aurora trials in dialysis patients
Comparing 4D, AURORA and SHARP: methodological considerations • Meta-analyses of patient-level data from CTT • Primary endpoints differed importantly: • SHARP did not include non-coronary cardiac deaths or hemorrhagic stroke, whereas 4D and AURORA did • Only SHARP included revascularization procedures • In AURORA, almost all of the cardiac deaths were coded as being coronary in nature • Hence, comparisons most valid for endpoints that were defined similarly in the 3 trials (ie, vascular death; MI; stroke; and coronary revascularization)
4D, AURORA and SHARP: Coronary revascularization Events (% pa) Allocated Allocated Risk ratio (RR) per LDL-C reduction control mmol/L LDL-C reduction Coronary revascularization 55 (3.31) 72 (4.29) 4D AURORA 55 (1.20) 70 (1.53) 149 (0.79) 203 (1.09) SHARP 259 (1.03) 345 (1.38) 0.72 (0.60 - 0.86) Subtotal: 3 trials 5243 (1.54) 6665 (1.98) 0.75 (0.72 - 0.78) Other 24 trials All trials 5502 (1.50) 7010 (1.94) 0.75 (0.72 - 0.77) 0.5 0.75 1 1.5 2 Control better LDL-C reduction 99% or 95% CI better c 2 Heterogeneity between renal trials: = 0.4 (p = 0.82) 2 c 2 Difference between renal and non-renal trials: = 0.1 (p = 0.72) 1
SHARP: Major Atherosclerotic Eventsbysex and age Risk ratio & 95% CI eze/simva placebo (n=4650) (n=4620) Sex Male 376 (12.9%) 445 (15.4%) Female 150 (8.6%) 174 (10.0%) Age at randomization (years) 40-49 56 (5.8%) 50 (5.5%) 50-59 85 (7.3%) 119 (10.4%) 60-69 163 (13.3%) 171 (13.7%) 70+ 222 (17.1%) 279 (21.2%) 0.83 (0.74-0.94) Major Atherosclerotic Event 526 (11.3%) 619 (13.4%) p=0.0021 • No significant heterogeneity: • by sex (p=0.9) • by age (p=0.44) 0.6 0.8 1.0 1.2 1.4 eze/simva better placebo better
SHARP: Major Atherosclerotic Eventsby prior vascular disease or diabetes eze/simva placebo Risk ratio & 95% CI (n=4650) (n=4620) Prior vascular disease Coronary disease 36 (21.3%) 35 (24.6%) Peripheral arterial disease 82 (27.0%) 87 (29.0%) Cerebrovascular disease 74 (22.0%) 77 (24.5%) At least one of above 3 conditions 167 (23.5%) 172 (25.2%) None 359 (9.1%) 447 (11.4%) Diabetes No diabetes 333 (9.3%) 385 (10.8%) Diabetes 193 (18.3%) 234 (22.5%) 0.83 (0.74-0.94) Major atherosclerotic event 526 (11.3%) 619 (13.4%) p=0.0021 No significant heterogeneity: (i) by prior vascular disease (p=0.27) (ii) by history of diabetes (p=0.45) 0.6 0.8 1.0 1.2 1.4 eze/simva better placebo better
SHARP: Major Atherosclerotic Events by CKD stage eze/simva placebo Risk ratio & 95% CI P value for Het/Trend (n=4650) (n=4620) MDRD estimated GFR (mL/min/1.73m²) ≥ 60 (stage 2) 3 (6.8%) 3 (6.8%) 0.50 ≥ 45< 60 (stage 3a) 6 (4.2%) 17 (10.8%) ≥ 30 <45 (stage 3b) 81 (8.5%) 93 (10.4%) ≥ 15 < 30 (stage 4) 127 (10.2%) 168 (12.7%) <15 (stage 5) 67 (10.9%) 81 (13.3%) Subtotal: Not on dialysis 296 (9.5%) 373 (11.9%) 0.78 (0.67-0.91) p=0.0016 Dialysis Hemodialysis 194 (15.2%) 199 (15.9%) 0.21 Peritoneal dialysis 36 (14.0%) 47 (19.7%) Subtotal: On dialysis 230 (15.0%) 246 (16.5%) 0.90 (0.75-1.08) p=0.25 0.83 (0.74-0.94) Major atherosclerotic event 526 (11.3%) 619 (13.4%) p=0.0021 0.6 0.8 1.0 1.2 1.4 eze/simva better placebo better
CTT: Effect on major vascular/atherosclerotic events by trial-midpoint LDL-C reduction 30 25 Statin vs control (21 trials) More vs less Not on dialysis 20 (5 trials) (22% MAE risk reduction) SHARP Proportional reduction in event rate (95% CI) 15 (17% MAE risk reduction) 10 Dialysis (10% MAE risk reduction) 5 0 0 10 20 30 40 Mean LDL cholesterol difference between treatment groups (mg/dL)
SHARP: Effects on Major Atherosclerotic Events (per 40 mg/dL LDL-C reduction) by renal status eze/simva placebo Risk ratio & 95% CI (n=4650) (n=4620) Non-dialysis 296 (9.5%) 373 (11.9%) Dialysis 230 (15.0%) 246 (16.5%) 0.81 (0.70-0.93) Major atherosclerotic event 526 (11.3%) 619 (13.4%) per mmol/L p=0.0021 0.6 0.8 1.0 1.2 1.4 placebo better eze/simva better Test for heterogeneity after LDL weighting p=0.65
SHARP: Summary of findings • Allocation to eze/simva produced: • mean study LDL-C reduction of 33mg/dL • 17% reduction in major atherosclerotic events • Similar, and significant, reductions in both: • Major atherosclerotic events (p=0.0021) • Major vascular events (p=0.0012) • Longer treatment, and better compliance, would be expected to lead to larger benefits • No evidence of serious adverse effects with eze/simva in vulnerable CKD patient population
SHARP: Public health impact of findings • Intention-to-treat analyses indicate that 21 per 1000 fewer patients had MAE over about 5 years (NNT=48) • Or, more appropriately, SHARP indicates that 21,000 fewer per million would have had MAE over 5 years • Benefits are similar to those seen with LDL-lowering therapy in other high-risk groups (eg, diabetic patients) • Observed benefit is an underestimate of actual use: • Longer treatment and better compliance would be expected to yield even larger reductions in absolute risk of events • SHARP excluded highest risk patients (eg, those with CHD)