Download

1 / 49
490 likes | 608 Vues
This presentation delves into the trends in pregnancy duration and the associated health outcomes for births in the United States between 1990 and 2011. It focuses on gestational ages, comparing outcomes of births at 39 weeks or more to those under 39 weeks. The analysis includes inductions of labor, cesarean delivery rates, and changes in early term and late preterm birth statistics. The findings suggest improvements in outcomes with longer gestation, highlighting the importance of understanding gestational age's impact on health.

E N D
Pushing for 39 weeks: Are pregnancies getting longer? Michelle J.K. Osterman, M.H.S. Joyce A. Martin, M.P.H. National Center for Health Statistics Extending Our Reach Through PartnershipsJune 2-6, 2013 Phoenix, Arizona
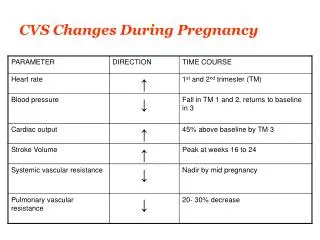
Why? • Better outcomes with longer gestation 39 or more weeks Early term 38 weeks 36 weeks 37 weeks 35 weeks Late preterm Under 39 weeks 34 weeks
Outline • Outcomes by gestational age • Late preterm (34-36 weeks) • 36 weeks • Early term births (37-38 weeks) • Labor and Delivery Management by gestational age • Induction of Labor • Cesarean delivery
Methods • Birth certificate data • 1990-2010 final • 2011 preliminary • Focus on births under 39 weeks • Gestational age based on date of last menstrual period • Singletons only
Methods • Includes all births • Medically-indicated • Nonmedically-indicated • Definitions • Induction of labor = artificial initiation of labor prior to the onset of spontaneous labor • Cesarean delivery = surgical extraction of the fetus, placenta, and membranes through abdominal incision
Births by gestational age: United States, 1990-2011 39 or more weeks Under 39 weeks NOTES: Singletons only. Source: CDC/NCHS, National Vital Statistics System
Births by gestational age: United States, 1990-2011 39 or more weeks Under 39 weeks 37% -11% NOTES: Singletons only. Source: CDC/NCHS, National Vital Statistics System
Gestational age groups • Under 39 weeks • Less than 34 weeks = Early preterm • 34-36 weeks = Late preterm • 37-38 weeks = Early term • 39 or more weeks
Births by gestational age: United States, 1990 and 2006 2006 1990 NOTES: Singletons only. Source: CDC/NCHS, National Vital Statistics System
Births by gestational age: United States, 1990, 2006 and 2011 2006 2011 1990 NOTES: Singletons only. Source: CDC/NCHS, National Vital Statistics System
Births by gestational age: United States, 2006 and 2011 Late preterm Early term NOTES: Singletons only. Source: CDC/NCHS, National Vital Statistics System
Births by gestational age: United States, 2006 and 2011 Late preterm Early term NOTES: Singletons only. Source: CDC/NCHS, National Vital Statistics System
Births by gestational age: United States, 2006 and 2011 Late preterm Early term NOTES: Singletons only. Source: CDC/NCHS, National Vital Statistics System
Births by gestational age: United States, 2006 and 2011 Late preterm Early term NOTES: Singletons only. Source: CDC/NCHS, National Vital Statistics System
Births under 39 weeks • 2006-2011 decrease • 36 weeks (late preterm) • 37 weeks (early term) • 38 weeks (early term) • Combine weeks 36-38
WA MT ND OR MN MA ID SD WY CT NJ DE NE OH DE IL UT CO WV CA VA KS DC MO KY TN OK AR SC AL GA TX FL Change in percentage of births occurring at 36-38 weeks: 2006 and 2011 ME VT NH WI NY RI MI PA IA NE IN MD NC AZ NM AK LA Decrease HI NOTES: Singletons only. Source: CDC/NCHS, National Vital Statistics System
Change in percentage of births occurring at 36-38 weeks: 2006 and 2011 MS Decrease No change NOTES: Singletons only. Source: CDC/NCHS, National Vital Statistics System
Induction of labor: United States, 1990-2011 All gestational ages NOTES: Singletons only. Source: CDC/NCHS, National Vital Statistics System
Induction of labor by gestational age: United States, 1990-2011 39 or more weeks Under 39 weeks NOTES: Singletons only. Source: CDC/NCHS, National Vital Statistics System
Induction of labor by gestational age: United States, 1990-2011 39 or more weeks Under 39 weeks -7% NOTES: Singletons only. Source: CDC/NCHS, National Vital Statistics System
Induction of labor by gestational age: United States, 1990 and 2006 2006 1990 NOTES: Singletons only. Source: CDC/NCHS, National Vital Statistics System
Induction of labor by gestational age: United States, 1990, 2006 and 2011 2006 2011 1990 NOTES: Singletons only. Source: CDC/NCHS, National Vital Statistics System
Births under 39 weeks • 2006-2011 decrease • 36 weeks (late preterm) • 37 weeks (early term) • 38 weeks (early term) • Combine weeks 36-38
Change in induction of labor at 36-38 weeks: 2006 and 2011 NOTES: Singletons only. Source: CDC/NCHS, National Vital Statistics System
WA MT ND OR MN ID MA SD CT WY NJ DE NE OH DE IL UT CO WV CA VA KS DC MO KY TN OK AR SC AL GA TX FL Change in induction of labor at 36-38 weeks: 2006 and 2011 Decrease NOTES: Singletons only. Source: CDC/NCHS, National Vital Statistics System
Change in induction of labor at 36-38 weeks: 2006 and 2011 ME VT WI NH RI PA IA NE MD NM MS Decrease No change NOTES: Singletons only. Source: CDC/NCHS, National Vital Statistics System
Change in induction of labor at 36-38 weeks: 2006 and 2011 NY MI IN NC AZ AK LA Decrease HI No change Increase NOTES: Singletons only. Source: CDC/NCHS, National Vital Statistics System
Cesarean delivery:United States, 1990-2011 All gestational ages NOTES: Singletons only. 2011 data are preliminary. Source: CDC/NCHS, National Vital Statistics System
Cesarean delivery by gestational age:United States, 1990-2011 Under 39 weeks 39 or more weeks NOTES: Singletons only. Source: CDC/NCHS, National Vital Statistics System
Cesarean delivery by gestational age:United States, 1990-2011 Under 39 weeks 39 or more weeks -2% NOTES: Singletons only. Source: CDC/NCHS, National Vital Statistics System
Cesarean delivery by gestational age: United States, 1996 and 2009 2009 1996 NOTES: Singletons only. Source: CDC/NCHS, National Vital Statistics System
Cesarean delivery by gestational age: United States, 1996, 2009 and 2011 2009 2011 1996 NOTES: Singletons only. Source: CDC/NCHS, National Vital Statistics System
Change in cesarean delivery at 37 weeks: 2006 and 2011 NOTES: Singletons only. Source: CDC/NCHS, National Vital Statistics System
Change in cesarean delivery at 37 weeks: 2006 and 2011 MA DE CO TX Decrease NOTES: Singletons only. Source: CDC/NCHS, National Vital Statistics System
WA MT ND OR MN ID SD RI WY CT NJ NE OH DE IL UT CA VA KS MO KY TN OK AR SC AL GA FL Change in cesarean delivery at 37 weeks: 2006 and 2011 ME VT NH WI NY MI PA IA NE IN NC AZ NM MS AK LA Decrease No change NOTES: Singletons only. Source: CDC/NCHS, National Vital Statistics System
Change in cesarean delivery at 37 weeks: 2006 and 2011 MD WV DC Decrease HI No change Increase NOTES: Singletons only. Source: CDC/NCHS, National Vital Statistics System
Change in cesarean delivery at 38 weeks: 2006 and 2011 NOTES: Singletons only. Source: CDC/NCHS, National Vital Statistics System
WA OR MN MA CT NJ NE OH DE IL UT CA MO OK SC GA FL Change in cesarean delivery at 38 weeks: 2006 and 2011 NH NY MI PA DE NE IN CO NC AZ AK TX Decrease HI NOTES: Singletons only. Source: CDC/NCHS, National Vital Statistics System
MT ND ID SD WY DE VA KS KY TN AR AL Change in cesarean delivery at 38 weeks: 2006 and 2011 ME VT WI RI IA MD WV DC NM MS LA Decrease No change NOTES: Singletons only. Source: CDC/NCHS, National Vital Statistics System
Summary • Overall rates • Induction of labor increased from 1990-2006 • Cesarean delivery increased from 1996-2009 • Among births under 39 weeks • 1990-2006 • Percentage of births increased • Most of increase occurred at late preterm and early term • Rate of induction of labor increased • Most of increase occurred at 36-38 weeks • 1996-2009 • Rate of cesarean delivery increased • Most of increase occurred at 37-38 weeks
Summary • Among births under 39 weeks • 2006-2011 • Percentage of births declined 11% • Most of decline occurred at 36, 37, and 38 weeks • Percent of 36-38-week births was down in 49 states and DC • Induction of labor rate declined 7% • All of decline at 36-38 weeks • Rates at 36-38 weeks declined in 32 states and DC; increased in 8 states
Summary • Among births under 39 weeks • 2009-2011 • Rate of cesarean delivery declined 2% • Decline mainly occurred at 37 and 38 weeks • Rates at 37 weeks declined in 4 states; increased in 2 states and DC • Rates at 38 weeks declined in 29 states; unchanged in 21 states and DC
Limitations • Induction of labor • Gestational age • No distinction for medical indication • Medical items not comprehensive • Current data quality concerns • E.g., fetal intolerance of labor
Conclusions • Induction of labor and cesarean delivery are declining for births under 39 weeks. • Percentage of births under 39 weeks declining • Decline in births under 39 weeks is more wide-spread than declines in induction of labor and cesarean delivery • Pregnancies are getting longer!