WFP in Indonesia
WFP in Indonesia. December 2011 @ IPB. The Magnitude of Undernutriton : Global picture. More than 1 billion of hungry and undernourished people in the world; 2 billion suffer from micronutrient deficiencies 56 million children are wasted (thin; low weight/height)

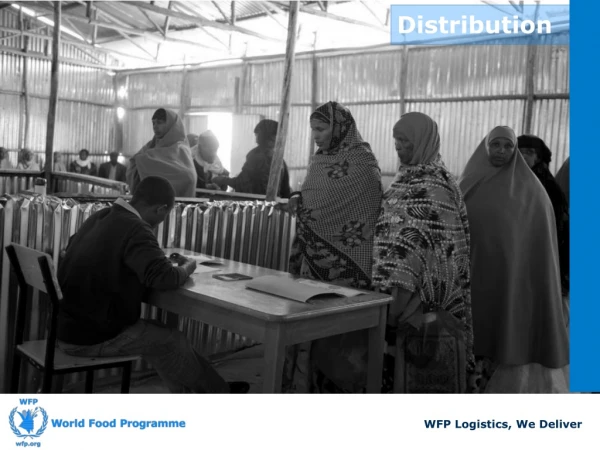
WFP in Indonesia
E N D
Presentation Transcript
WFP in Indonesia December 2011 @ IPB
The Magnitude of Undernutriton:Global picture • More than 1 billion of hungry and undernourished people in the world; • 2 billion suffer from micronutrient deficiencies • 56 million children are wasted (thin; low weight/height) • About 180 million stunted children (small; low height/age)
Link between undernutrition and mortality: Mortality Rate by age group in Africa, Asia, and the US Under 5 mortality is higher in Africa and S.A. than the US Death rates in the US only increase after the age of 50 No of deaths (per 1000) 30% of under-5 mortality is a result of nutrition related causes Age Group Comparison of Mortality by age per 1000 people in Africa, South Asia and the US Source: Life tables for WHO Member States. Geneva, World Health Organization, 2011. (Also available at http://www.who.int/whosis/database/life_tables/life_tables.cfm) 1. SEAR (South-East Asia Region) includes . Bangladesh Bhutan Dem. People's Rep. of Korea India Indonesia Maldives Myanmar Nepal Sri Lanka Thailand Timor-Leste
Saving lives: Wasting, Stunting, Micronutrient Deficiencies and Risk of Dying Prevalence (%) < 24 mo ≥ 24 mo Micronutrient deficiencies among non-stunted, non-wasted children account for 10%of child mortality Stunting accounts for 15% of child mortality MAM accounts for 10% of child mortality UNICEF: Severe acute malnutrition accounts for only4%of child mortality Age (months) Attributed Child Mortality Burden by Nutritional Cause Source: Ethiopia Demographic and Health Survey (2011); Lancet Nutrition Series, 2008
Healthy vs Malnourished Brains What is the difference in brain scans of these two under-5 children?
Impact of Nutrition and Health towards Brain’s Growth and Development
The Consequences of Stunting (Lancet 2008) • Chronic Diseases: Children who are undernourished in the first 2 years of life and who put on weight rapidly later in childhood and in adolescence are at high risk of chronic diseases related to nutrition (diabetes, cardio-vascular diseases, hypertension, etc) • The window of prevention = the first 1000 days = from conception to 24 months
New WFP Nutrition Policy with five main pillars WFP Nutrition Strategy Treatment of moderate acute malnutrition 1 2 Prevention of acute malnutrition 3 Prevention of chronic malnutrition Nutrition activities focused on vulnerable groups incl. young children, Pregnant & Lactating Women, People Living with HIV Addressing micronutrient deficiencies: among vulnerable groups, especially to save lives in emergencies; for general population through food fortification 4 5 Ensure other programmes contribute to improved nutrition outcomes General Food Distribution School Feeding Food for Work / Asset / Training Others Enabling environment: Technical Assistance and Advocacy with governments and other stakeholders
REACH (FAO, UNICEF, WFP and WHO) partnership Malnutrition Inadequate dietary intake Disease Inadequate access to food Inadequate care for children and women Insufficient health services & unhealthy environment Food Production Incomes Government expenditures FAO Basic Causes UNICEF interventions WFP interventions WHO (normative) Source:: UNICEF Framework
Preliminary results indicate that in TTS District around 80-90% of all HHs are not able to afford a Minimum Cost Nutritious Diet 80% - 90% of HHs cannot afford a minimum cost of nutritious diet Surveyed Households (HHs) Source: Pilot Food Security and Nutrition Monitoring System in Indonesia, TTS, April, 2011, n=50; WFP CoD Analysis in TTS, 2011. Note: Household Size: 5 members, including 1 child 12-23 months
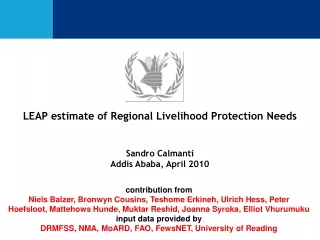
WFP Indonesia 2012-15: Towards food security for all
Country Programme Objectives To strengthen the Indonesian capacity to address food insecurity through enhanced monitoring, analysis, and mapping capacity; prepare for and respond to disasters and shocks; and reduce under-nutrition below critical levels.
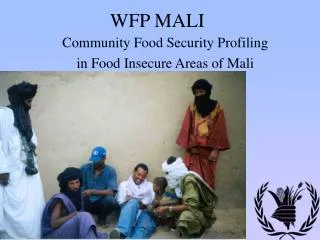
Collaboration with FAO and IFAD Climate change: Coastal Habitat Education and Rehabilitation Program Joint programming: UNPDF Nutrition: Nutrition Map of Indonesia (2006) Assessment: UN Joint Food and Nutrition Security Assessment in NTT Province (2010)
WismaKeiai9th fl., Jl. Jend. SudirmanKav 3, Jakarta 10220, Indonesia Telephone: +62 21 5709004 | Fax: +62 21 5709001
VAM tools in WFP Indonesia National Food Insecurity Atlas (FIA, 2005) National Food Security and Vulnerability Atlas of Indonesia (FSVA, 2009) Early Warning System Bulletin (joint w/ LAPAN) Nutrition Map of Indonesia (2006) Provincial Food Security and Vulnerability Atlas (2011) Food and Nutrition Surveillance System at Village Level (FNSS) Food and Nutrition Security Monitoring at Household Level (FNSMS, 2009-11) UN Joint Food and Nutrition Security Assessment (2010)
WFP’s Approach to Support Climate Change Adaptation and Mitigation (REDD+) • Approach: • Focus on the impact of climate change on food security and nutrition • Focus on the most vulnerable and food insecure by using FSVA • Pursue a twin track approach (enhancing both production and access to food) • Support nationally-owned solutions through enhanced partnerships • Link climate change (CC) and disaster risk reduction (DRR) • Current and planned initiatives: • In cooperation with NTB and NTT Government to develop local level adaptation strategies and implementation actions • In cooperation with the REDD Task Force Aceh to develop concept for incentives mechanism for local community as the beneficiaries of REDD+
Public Private PartnershipProject Laser Beam Five-year, US$50 million PPP that seeks to eradicate child malnutrition. WFP’s core priority will be on prevention of malnutrition among children under two and pregnant and lactating mothers, which is essential to prevent stunting. Brings together the expertise of UN agencies with that of private companies to work with local governments and companies to find new solutions to old problems.
UNPDF Five Working Groups plus Theme Group Disaster Risk Reduction (Led by OCHA) Social Services (Led by UNICEF) Sustainable Livelihoods (Led by ILO) Climate Change (Led by UNESCO) Governance (Led by UNDP) Food Security (Led by WFP and FAO)
Emergencies Cluster Approach
Extreme weather (individual/HH level) Food consumption (macro level) Crop price (macro level) Productivity (individual level) Nutrition status WFP’s Perspective on Climate Change and Deforestation Impacts to Food Security Availability Access Utilization (HH level) Harvest failure (HH level) Income Climate change Climate related disaster* Land degradation Deforestation * Disaster from flood, drought, forest fire, and landslides