Research Process Steps: Identifying Variables and Observations
280 likes | 300 Vues
This presentation and activity pack discusses the research process steps, with a focus on identifying variables and different types of observation. Includes a group activity and data analysis worksheet.

Research Process Steps: Identifying Variables and Observations
E N D
Presentation Transcript
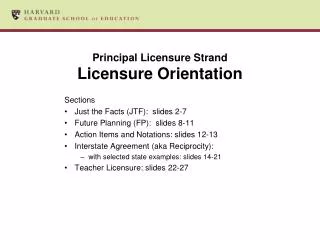
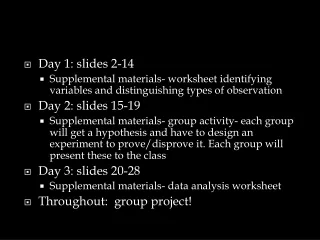
Day 1: slides 2-14 • Supplemental materials- worksheet identifying variables and distinguishing types of observation • Day 2: slides 15-19 • Supplemental materials- group activity- each group will get a hypothesis and have to design an experiment to prove/disprove it. Each group will present these to the class • Day 3: slides 20-28 • Supplemental materials- data analysis worksheet • Throughout: group project!
Today’s Objective • Know the steps of the research process • Understand all steps!
The Research Process Steps • Identify problem/form hypothesis • Gather data • Observe -and/or- • Experiment -and/or- • Survey • Research report
The Research Process Steps • Identify problem/form hypothesis • Gather data • Observe -and/or- • Experiment -and/or- • Survey • Research report
Step 1: Identify Problem/ Form Hypothesis • Problem: can be almost anything • Ex: Increase gang violence, high crime rate, teen pregnancy has skyrocketed; violence has fallen, racism is lessening, etc • Hypotheses: Statement, not questions • EX: Poor People are more likely to become criminals than rich people; People with lower IQ’s are more likely to cheat on a test; an Atheist is more likely to commit a crime, than Christians
Step 2: Gathering Data • In Sociological Inquiry you often look at your research compared to past research, studies, etc… • To understand your subject use the library, internet, or interviews to give you a basis of understanding
Step 3: Observation • In answering your hypothesis, you may use one or all of the following steps: 3, 4, or 5. • Observation means people watching
Types of Observation • Concealed participant observation • Open participant observation • Non-participant observation
Concealed Participant Observation • You observe while incognito • EX: the movie “never been kissed” • Wear a disguise or act like someone else to obtain your information
Open Participant Observation • You are recognized and accepted as an outsider • EX: You want to learn about an African tribe. • You join the tribe and live with them for an extended period of time
Non-participant observation • You hide while observing • EX: You want to know how a person arrested for a crime acts when interrogators leave the room • you look behind 1 way glass, you hide a camera in the room, you have a secret peephole, etc…
Pros and cons of observation Pros Cons • 1st hand account • Actions don’t lie • Can’t be everywhere at once • May misinterpret • People may behave differently b/c they are being observed
Activity • Identify which type of observation each of the following examples represents: • You observe through a crack in a wall • You observe farmers while dressed up like a chicken • You ask the elks lodge if you can attend their meetings, but not join as a member.
Step 4: the Experimental Method • Just like a science experiment, this uses 2 groups: control and experimental • EX: Group A (experimental): honor roll students Group B (control): all high school students of driving age Compare each groups’ accident reports
Experiments may consist of only 1 group if there is a before and after element • EX: You get the reactions of people to a scene that shows gender discrimination, then show a movie on it. Do the same experiment w/ the same group and see if their reactions change.
Independent and Dependent Variables • Independent (IV): what you are testing; the variable that is being manipulated; answers “what do I change?” • Dependent (DV): what changes as a result of your IV; answers “what am I observing?” • If you take a daily vitamin, you will extend your life expectancy • The more calories you consume, the more weight you will gain. • If you have a child, you will receive less sleep.
Pros and Cons of Experiments Pros Cons • Can be done in your lab • Easy to keep controls constant • Easy to monitor • Not always possible or humane • People may behave differently in an experimental setting, than in life • Hard to get volunteers
Activity • How might you run an experiment for this hypothesis? • Drivers education makes young drivers more safe on the road. • Identify the variable. • What would be your control(s)?
Step 5: Surveys • Samples a small group as representatives of a large group • Usually anonymous questionnaires used to get people’s opinion and/or histories • Can be in the form of an interview • EX: Sample 10 Klingeman students to see if she is an effective teacher.
The Survey • Must be clear and unbiased • Good EX: Do you agree or disagree with the War on Terrorism? • Bad EX: Do you agree that the War on Terrorism is a political strategy used by the Republican party to further their goals of obtaining oil by ruling over middle eastern countries?
Conducting a survey • Be polite and unbiased in your introduction • Give a time frame (may I have 10 minutes of your time) • Ask the same question in a variety of ways • OR- mail/email a survey (less likely to get a response) • For more info see pp. 436-446 in your text
Analyzing Data • Score surveys and record data in a graph or table • Decide whether results are causal or correlated • Causal- the amt of food you eat indicates how much you will weigh • Eating too much makes you gain weight • Correlated- variables are connected, but not necessarily causal • Many obese people have short hair (your survey may show that relationship, but obesity didn’t cause short hair or vice versa)
+ and - correlations • +correlation: as one variable increase the other will as well, as one variable decrease the other will also • Survey shows the higher your IQ, the better your grades are • -correlation: as one variable increases the other decreases, as one variable decreases, the other increases • Survey shows the higher your IQ, the worse your grades are
The Pros and Cons of Surveys Pros Cons • Honesty (if anonymous) • Less time consuming (minutes) • Easy to score (unless open-ended) • Can bore people • Illiteracy • Must be written well • Some people will not take it seriously
Step 6: The Research Report • This is where you share your research w/ others • It includes: • An account of the problem • A summary of previous research you found (not in your project report tho) • Your hypothesis
The research design (experiment, survey, etc) • Data summarized in tables, graphs, etc • Your analysis of the data (a positive correlation exists between McD’s and weight gain) • Your conclusions(ex: shucks, eating McDonald’s 2X a day for a year makes you fat)
In Summation… • Research is central to the field of Sociology • Although the topic may be spurred by the researchers interest in a certain field of society, bias must be left out of the process