Download
1 / 23
250 likes | 315 Vues
2004-2005 U.S. RF noise data overview by NOAA aims to mitigate interference for sensitive systems. Frequency band profiling and analysis methodologies detailed.

E N D
Presented By: Robert Leck NOAA’s National Weather Service (QSS Group Inc.) Results of Ambient RF Environment and Noise Floor Measurements Taken in The U.S. In 2004 and 2005 March 2006
Overview • NOAA operates a wide variety of sensitive systems. • Increased noise floor levels can negatively impact the operation of these systems. • Base lining the current noise floor levels will provide a basis for future comparative measurements.
Ambient RF Environment Measurement System (ARFEMS) Objectives • Profile the ambient noise floor within frequency bands of interest to NOAA. • Establish an archived database. • Establish a basis for future comparative measurements. • Collect data that can be used for additional interference studies.
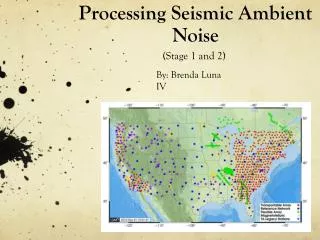
Site Locations San Diego, CA Wallops Island, VA Albany, NY Phoenix, AZ
Horn Antennas Frequency Range 1 Spectrum Analyzer LNA Bandpass Filter Coaxial Switch Frequency Range 2 LNA Bandpass Filter RF Input Ethernet Frequency Range N Above 26 GHz Frequency Range X Direct To Spectrum Analyzer LNA Bandpass Filter HarmonicMixer Hub Frequency Range Y Remote Spectrum Analyzer Monitor LNA Direct To Spectrum Analyzer Bandpass Filter Harmonic Mixer Laptop w/Lab View Ethernet Ethernet Frequency Range N Temperature Sensor Variable Azimuth Drive RS-232 Remote Video Camera Ethernet GPIB/Ethernet Converter System Overview Laptop For Remote Video Camera
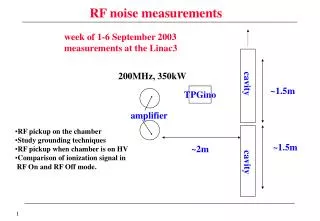
Measurement Methodology • A spectrum analyzer was the primary measurement device. • Horizontal and vertical polarization profiles were captured over a 360-degree range of azimuths. • The ambient RF environment was profiled while characterizing the noise floor.
Data Analysis MethodologyData Reduction • The Ambient Noise Floor was derived from post processing of Spectrum Analyzer measurements. • Data was processed to compensate for system gains and losses. • Interfering signals were removed from the ambient noise floor measurement. • All measurements were referenced to a measurement resolution bandwidth of 1 Hz.
Data Analysis MethodologyData Reduction • In some cases the field measurements were equivalent to the measurement systems noise floor. • In these cases the ambient noise floor was not detectable and was assumed to be below or closely equivalent to the system noise floor.
Measurement Results (Horizontal Polarization) Ambient Noise Level (Horizontal Polarization) Urban Suburban Rural Airport 136 MHz-138 MHz -130 26.25 GHz - 27.0 GHz 162 MHz-174 MHz -140 25.5 GHz-26.25 GHz 400 MHz-420 MHz -150 23.6 GHz-24.1 GHz 440 MHz-460 MHZ -160 -170 18.5 GHz-19 GHz 1.54 GHz-1.545 MHz -180 -190 -200 18 GHz-18.5 GHz 1.670 GHz-1.700 GHz 17.6GHz- 18 GHz 2 GHz-2.3 GHz 10.6 GHz-11.3 GHz 2.7 GHz-3.0 GHz 9.3 GHz-9.5 GHz 5.6 GHz-5.650 GHz 8.025 GHz-8.375 GHz 6.4 GHz-6.8 GHZ 7.45 GHz-7.83 GHz
Measurement Results (Horizontal Polarization) Ambient Noise Level (Horizontal Polarization) Urban Suburban Rural Airport 136 MHz-138 MHz -130 26.25 GHz - 27.0 GHz 162 MHz-174 MHz -140 25.5 GHz-26.25 GHz 400 MHz-420 MHz -150 23.6 GHz-24.1 GHz 440 MHz-460 MHZ -160 -170 18.5 GHz-19 GHz 1.54 GHz-1.545 MHz -180 -190 -200 18 GHz-18.5 GHz 1.670 GHz-1.700 GHz 17.6GHz- 18 GHz 2 GHz-2.3 GHz 10.6 GHz-11.3 GHz 2.7 GHz-3.0 GHz 9.3 GHz-9.5 GHz 5.6 GHz-5.650 GHz 8.025 GHz-8.375 GHz 6.4 GHz-6.8 GHZ 7.45 GHz-7.83 GHz
Measurement Results (Horizontal Polarization) Ambient Noise Level (Horizontal Polarization) Urban Suburban Rural Airport 136 MHz-138 MHz -130 26.25 GHz - 27.0 GHz 162 MHz-174 MHz -140 25.5 GHz-26.25 GHz 400 MHz-420 MHz -150 23.6 GHz-24.1 GHz 440 MHz-460 MHZ -160 -170 18.5 GHz-19 GHz 1.54 GHz-1.545 MHz -180 -190 -200 18 GHz-18.5 GHz 1.670 GHz-1.700 GHz 17.6GHz- 18 GHz 2 GHz-2.3 GHz 10.6 GHz-11.3 GHz 2.7 GHz-3.0 GHz 9.3 GHz-9.5 GHz 5.6 GHz-5.650 GHz 8.025 GHz-8.375 GHz 6.4 GHz-6.8 GHZ 7.45 GHz-7.83 GHz
Measurement Results (Vertical Polarization) Ambient Noise Level (Vertical Polarization) Urban Suburban Rural Airport 136 MHz-138 MHz -130 26.25 GHz - 27.0 GHz 162 MHz-174 MHz -140 25.5 GHz-26.25 GHz 400 MHz-420 MHz -150 23.6 GHz-24.1 GHz 440 MHz-460 MHZ -160 -170 18.5 GHz-19 GHz 1.54 GHz-1.545 MHz -180 -190 -200 18 GHz-18.5 GHz 1.670 GHz-1.700 GHz 17.6GHz- 18 GHz 2 GHz-2.3 GHz 10.6 GHz-11.3 GHz 2.7 GHz-3.0 GHz 9.3 GHz-9.5 GHz 5.6 GHz-5.650 GHz 8.025 GHz-8.375 GHz 6.4 GHz-6.8 GHZ 7.45 GHz-7.83 GHz
Measurement Results (Vertical Polarization) Ambient Noise Level (Vertical Polarization) Urban Suburban Rural Airport 136 MHz-138 MHz -130 26.25 GHz - 27.0 GHz 162 MHz-174 MHz -140 25.5 GHz-26.25 GHz 400 MHz-420 MHz -150 23.6 GHz-24.1 GHz 440 MHz-460 MHZ -160 -170 18.5 GHz-19 GHz 1.54 GHz-1.545 MHz -180 -190 -200 18 GHz-18.5 GHz 1.670 GHz-1.700 GHz 17.6GHz- 18 GHz 2 GHz-2.3 GHz 10.6 GHz-11.3 GHz 2.7 GHz-3.0 GHz 9.3 GHz-9.5 GHz 5.6 GHz-5.650 GHz 8.025 GHz-8.375 GHz 6.4 GHz-6.8 GHZ 7.45 GHz-7.83 GHz
Measurement Results (Vertical Polarization) Ambient Noise Level (Vertical Polarization) Urban Suburban Rural Airport 136 MHz-138 MHz -130 26.25 GHz - 27.0 GHz 162 MHz-174 MHz -140 25.5 GHz-26.25 GHz 400 MHz-420 MHz -150 23.6 GHz-24.1 GHz 440 MHz-460 MHZ -160 -170 18.5 GHz-19 GHz 1.54 GHz-1.545 MHz -180 -190 -200 18 GHz-18.5 GHz 1.670 GHz-1.700 GHz 17.6GHz- 18 GHz 2 GHz-2.3 GHz 10.6 GHz-11.3 GHz 2.7 GHz-3.0 GHz 9.3 GHz-9.5 GHz 5.6 GHz-5.650 GHz 8.025 GHz-8.375 GHz 6.4 GHz-6.8 GHZ 7.45 GHz-7.83 GHz
Conclusions • The ambient noise floor was higher in frequency bands below 400 MHz. • At measurement frequencies of less than 2GHz, variations on the order of 1 to 5 db were seen in the ambient noise floor measurements across urban, suburban, rural and airport environments.
Conclusions • At frequencies within the 2 GHz to 23.6 GHz bands, the ambient noise floor was below the sensitivity of the measuring equipment for horizontally polarized measurements. • At frequencies within the 2 GHz to 10.6 GHz bands, the ambient noise floor was below the sensitivity of the measuring equipment for vertically polarized measurements.
Conclusions • At frequencies within the 23.6 GHz to 28 GHz bands a variation of 1 to 5 dB was seen in the ambient noise floor measurements across urban, suburban, airport and remote environments for horizontally polarized measurements.
Conclusions • At frequencies within the 10.6 GHz to 28 GHz bands a variation of 1 to 5 dB was seen in the ambient noise floor measurements across urban, suburban, airport and remote environments for vertically polarized measurements.
Conclusions • Urban environments exhibited the highest level of ambient noise. • The data set provides a baseline for future comparative measurements.
Next Steps • Additional testing is planned for the 2006-2007 time frame. • Testing will take place at sites that have been tested in the past. • Comparative analysis of the 2004-2005 and the 2006-2007 data will be made and summarized in an upcoming report.