Understanding Basic EKG
670 likes | 1.44k Vues
Understanding Basic EKG. Zabrina Bellina University of Central Florida Teaching With Technology Project. Objectives:. At the conclusion of this presentation, students will able to: 1. Describe coronary circulation and gain working knowledge of blood supply to heart structures.

Understanding Basic EKG
E N D
Presentation Transcript
Understanding Basic EKG Zabrina Bellina University of Central Florida Teaching With Technology Project
Objectives: At the conclusion of this presentation, students will able to: 1. Describe coronary circulation and gain working knowledge of blood supply to heart structures. Define the term electrocardiography and describe the electrical conduction system of the heart.
Objectives Correlate electrical events in the heart with the waveform represented in a normal EKG. Gain understanding of EKG interpretation through waveform measurement, analysis, and correct rate computation of rhythm strips. Understand and identify lethal cardiac arrhythmia waveforms.
Coronary Circulation Review Figure 1
Superior & Inferior Vena Cava Coronary Circulation Review Right Atrium Tricuspid Valve Right Ventricle Pulmonary Semi-lunar Valve
Pulmonary Trunk Right & Left Pulmonary Arteries Lungs Pulmonary Veins Left Atrium
Mitral Valve Left Ventricle Aortic Semi-lunar Valve Aorta Body
Right Coronary Artery supplies blood to: Right Atrium Right Ventricle the SA Node in 55% of population the LV inferior wall the LV posterior wall and ⅓ of the posterior interventricular septum in 90% of the population
Left Circumflex Artery supplies blood to: the Left Atrium the LV lateral wall the SA Node in 45% of the population and to the LV posterior wall ⅓ of the interventricular septum AV Node and Bundle of His in 10% of the population
Left Anterior Descending Artery supplies blood to: • the LV anterior and lateral walls • the Left and Right Bundle Branches • the anterior ⅔ of the interventricular septum
Coronary Artery Blood Supply Remember: The Right Coronary Artery supplies both the Rightand Left heart. The Left Coronary Artery and its branches only supply the Left heart.
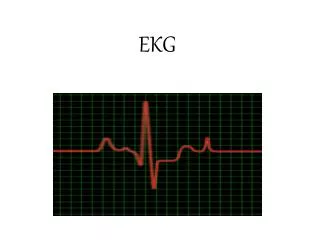
What is an EKG? An electrocardiogram (ECG) , also known as an EKG, is a graphic recording of the electrical activity of the heart. It is used as a diagnostic tool to assess cardiac function.
Electrocardiogram An EKG is a painless procedure that can be performed by placing disposable electrodes on the skin of a person’s chest wall, upper and lower extremities. Figure 2 Figure 3
Electrocardiogram An EKG can be recorded with 12, 15, and sometimes even 18 leads. However, the 12 lead EKG is the most commonly used tool to diagnose cardiac conduction abnormalities, arrhythmias, myocardial infarction and ischemia.
Electrocardiogram Remember, an EKG represents the electricalimpulses that the heart transmits and are recorded as tracings on specialized graph paper.
Cardiac Conduction 101 The Conduction System of the Heart Figure 4
Cardiac Conduction 101 The SA Node is the primary pacemaker for the heart at 60-100 beats/minute The AV Node is the “back-up” pacemaker of the heart at 40-60 beats/ minute
Cardiac Conduction 101 The Ventricles (bundle branches & Purkinje fibers) are the last resort and maintain an intrinsic rate of only 20-40 beats/minute
Cardiac Conduction 101 Let’s look at a normal conduction pathway:
Cardiac Conduction 101 Myocardial Cells = the mechanical cells of the heart. They contract when they receive an electrical impulse from the pacemaker cells. Myocardial = Muscle (Brawn)
Cardiac Conduction 101 Pacemaker Cells are very small cells within the conduction system which spontaneously generate electrical impulses. Pacemaker = Power Source (Brain)
Cardiac Conduction 101 Electrical Conducting Cells rapidly carry current to all areas of the heart. Conducting Cells = Hard Wiring of Heart (Fuel)
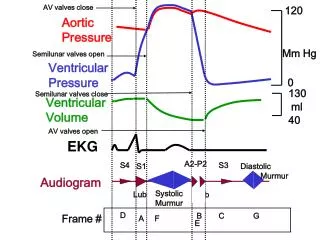
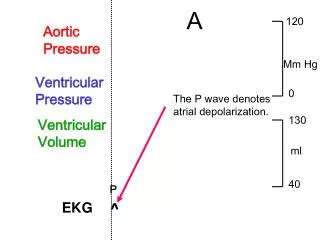
Cardiac Conduction 101 Ventricular Systole Now, let’s correlate the mechanical activity with the electrical activity…. Figure 5 Atrial Systole Ventricles repolarize Atria depolarize Ventricles depolarize
Cardiac Conduction 101 Depolarization occurs when sodium channels open fast and the inside of the membrane becomes less negative (electrical stimulation). This is manifested as the P wave on an EKG, which signifies atrial muscle depolarization.
Cardiac Conduction 101 The plateau that immediately follows the P wave represents atrial systole, when calcium channels open slowly and potassium channels close(at this time mechanical contraction of the atria takes place).
Cardiac Conduction 101 The PR interval on an EKG reflects conduction of an electrical impulse from the SA node through the AV node. PR = 0.12 – 0.20 seconds Figure 6
Cardiac Conduction 101 The QRS complex of an EKG reflects ventricular muscle depolarization (the electrical impulse moves through the Bundle of His, the left and right bundle branches and Purkinje fibers). QRS = 0.08 – 0.10 seconds
Cardiac Conduction 101 The QT interval measures the time from the start of ventricular depolarization to the end of ventricular repolarization. QT interval = < 0.43 seconds or ½ of the R-to-R interval
Cardiac Conduction 101 TheST segment reflects the early ventricular repolarizationand lasts from the end of the QRS complex to the beginning of the T wave.
Cardiac Conduction 101 The T-wave on an EKG reflects ventricular muscle repolarization (when the cells regain a negative charge - the “resting state”) and mechanical relaxation, which is also known as diastole.
EKGs Revisited Keep in mind how electricity flows… When an electrical current moves toward a positiveelectrode, the deflection on the EKG strip will be positive (up). When an electrical current moves toward a negative electrode, the deflection on the EKG strip will be negative(down).
EKGs Revisited ST Segment Changes Any elevation in the ST segment that is greater than two small boxes is indicative of myocardial injury. Any ST segment depression greater than two small boxes indicates myocardial ischemia.
EKG Paper EKG paper comes in a roll of graph paper consisting of horizontal and vertical light and dark lines. The horizontal axis measures time Figure 7 The vertical axis measures voltage
EKG Paper One small square = 0.04 seconds One large square = 0.2 seconds or One small square(0.04) x 5
EKG Paper The light lines circumscribe small squares of 1 x 1 mm One small square = 0.1 mV The dark lines delineate large squares of 5 x 5 mm One large square = 0.5 mV
EKG Analysis • Rhythm • Rate • P - waves • PR Interval • QRS Complex
EKG Rate Analysis Rate What’s the normal heart rate for an adult human being? 60 – 100 beats/ minute Is the rate in your strip too fast or too slow?
EKG Rate Analysis In terms of rate computation, heart rate generally refers to the number of ventricular contractions that occur in 60 seconds or one minute. When calculating rates, if there is a P-wave in front of every R-wave, the atrial and ventricular rates will be the same. .
EKG Rate Analysis Atrial rate can be calculated by measuring the interval of time between P-waves (the P-to-P intervals). Ventricular rate can be calculated by measuring the time intervals between QRS complexes (the R-to-R intervals).
EKG Rate Analysis There are instances, such as 2nd and 3rd degree AV block, in which the atrial rate and ventricular rates are different. This is why it is important to know how to determine both atrial and ventricular rates.
EKG Rate Computation Rules Count the number of QRS’s in a 6 - second strip, then multiply that number by 10. Determine the time between R-R intervals, then divide that number by 60. For example: 40 ÷ (20 small boxes x 0.04 seconds each) = 50 beats per minute
EKG Rate Computation Rules Memorize these numbers: 300, 150, 100, 75, 50 Normal Heart rate for an adult = 60 -100 bpm This means that 3 to 5 large blocks should exist between R – R intervals. Bradycardia = more than 5 large blocks Tachycardia = less than 3 large blocks
EKG Rate Computation Figure 8
EKG Rate Analysis Let’s Practice with an Example: Figure 9 What is the rate based on Rule #1? If you said 50 bpm…. You are Correct!!!
EKG Rhythm Analysis Questions: Are the P waves regular or irregular? Are the R-to-R intervals regular or irregular?
EKG P-wave Analysis Questions: Are there P-waves in your rhythm strip? Is there a P-wave for each QRS complex? Do all of the P-waves look the same?
EKG PR Interval Analysis Questions: Is the PR Interval measurement normal? PR = 0.12 – 0.20 seconds Is the PR Interval measurement constant?
EKG QRS Analysis Questions: Is the QRS wide? > 0.10 Is it normal? QRS = 0.08 – 0.10 seconds Or is it narrow? < 0.08
EKG Analysis Questions: Is the T-wave peaked, inverted or flat? Is the ST segment elevated, depressed or normal? Is the QT Interval < 0.43 seconds? Is there any ectopy present?
EKG Interpretation Let’s try an example….. Figure 10 Is the rhythm regular or irregular? Regular Are the P-waves identical? Is there a P-wave for each QRS complex? Yes for both! Is the PR Interval 0.12 – 0.20? Yes, PR = 0.16