Download
1 / 18
180 likes | 406 Vues
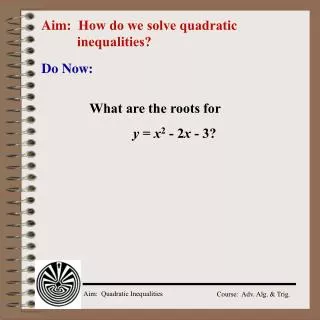
Aim: How do we solve quadratic inequalities?. Do Now:. What are the roots for y = x 2 - 2 x - 3?. x -intercepts. x -axis. -1,0. 3,0. 0 = x 2 - 2 x - 3. Graph y = x 2 - 2 x - 3. Finding the roots/zeroes:. Graphically:. where the parabola crosses the x -axis.

E N D
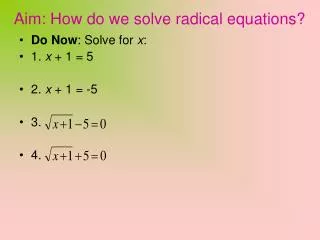
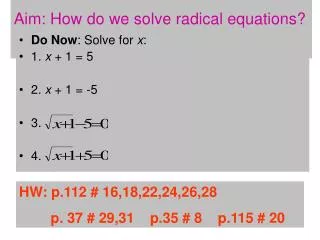
Aim: How do we solve quadratic inequalities? Do Now: What are the roots for y = x2 - 2x - 3?
x-intercepts x-axis -1,0 3,0 0= x2 - 2x - 3 Graph y = x2 - 2x - 3 Finding the roots/zeroes: Graphically: where the parabola crosses the x-axis Algebraically: factor and solve for x. y = 0 represents the x-axis and the solution to quadratic x2 - 2x - 3 = 0 is found at the intersection of the parabola and x-axis 0= (x - 3)(x + 1) x = 3 and x = -1
x 2 + 2x y (-2,4) 0 2 + 2(0) 2 1 4 2 + 2(1) 2 2 + 2(2) 6 Graphing a Linear Inequality Graph the inequality y - 2x > 2 y - 2x > 2 +2x+2x 1. Convert to standard form y> 2 + 2x 2. Create Table of Values y = 2 + 2x Note: the line is now solid. 3. Shade the region above the line. 4. Check the solution by choosing a point in the shaded region to see if it satisfies the inequality y - 2x > 2 4 - 2(-2)> 2 4 - (-4)> 2 8> 2
y < mx + b y > mx + b Graphing a Linear Inequality An inequality may contain one of these four symbols: <, >, >, or <. y<mx + b y>mx + b The boundary line is part of the solution. It is drawn as a SOLID line. The boundary line isnot part of the solution. It is drawn as a DASHED line.
Aim: How do we solve quadratic inequalities? Do Now: Graph: y – 3x < 3 Solve: y – 3x2 = 9x – 12
y > x2 - 2x - 3 y < x2 - 2x - 3 (x, y) (x, y) -1,0 3,0 Quadratic Inequalities - Graphically y > x2 - 2x - 3 & y < x2 - 2x - 3 -1 < x < 3 x < -1 or x > 3 -1,0 3,0 > Shaded inside the curve < Shaded outside the curve What values of x satisfy these inequalities when y = 0 0 > x2 - 2x - 3 0 < x2 - 2x - 3 The values of x found within the shaded regions.
x-axis -1,0 1,0 roots Graph y ≥ x2 - 1 or x2 - 1 ≤ y Graphically: Because y is greater than or equal to (≥) x2 - 1, the parabola is shaded inside the curve and includes the curve itself What values of x satisfy the quadratic inequality when y = 0? -1 ≤ x ≤ 1 (x2 – 1 = 0)
(2,0) (2,0) Exceptions - 1 0 y >x2 - 4x + 4 Quadratic Inequalities that have roots that are equal y >x2 - 4x + 4 0 = y >x2 - 4x + 4 = (x - 2)(x - 2) x = 2 root/zero What values of x satisfy the quadratic inequality0>x2 - 4x + 4? Solution: {x| x = 2} 0 y < x2 - 4x + 4 What values of x satisfy the quadratic inequality 0< x2 - 4x + 4? Solution:
Exceptions - 2 y > x2 + 1 Quadratic Inequalities that have no roots. What values of x satisfy the quadratic inequality0> x2 + 1? (0, 1) Solution: {x| x = } y < x2 + 1 What values of x satisfy the quadratic inequality 0< x2 + 1? Solution: {x| x = } (0, 1)
r1 r2 r1 r2 r1 r2 General Solutions of Quadratic Inequalities where a > 0 and r1 < r2 (r1 and r2 are the unequal roots) r1 r2
(x + 1)(x – 3) = 0 roots, or zeros (3,) (-, -1) (-1, 3) (-1, 3) (-, -1) (-1, 3) (3, ) Critical Numbers & Test Intervals x2 – 2x – 3 < 0 x = -1 and x = 3 are the roots or the zeros that create 3 test intervals (-1,0) (3,0) Critical Numbers for testing the inequality Is this value < 0? x = -3 (-3)2 – 2(-3)– 3 = 12 No Yes x = 0 (0)2 – 2(0)– 3 = -3 No x = 5 (5)2 – 2(5)– 3 = 12
Model Problems Solve algebraically and Graph: y < x2 – 12x + 27 0 < x2 – 12x + 27
Model Problems Graph the solution set for x2 – 2 > -x – 3
Regents Question Which graph best represents the inequality y + 6 > x2 – x? 1) 2) 3) 4)
Model Problems Graph the solution set for 2(x – 2)(x + 3) < (x – 2)(x + 3)
-1,0 1,0 roots Solve 0 ≥ x2 - 1 algebraically Algebraically: 0≥ x2 - 1 0≥ (x - 1)(x + 1) 0≥ (x - 1) 0≥ (x + 1) ? x ≥ 1 and x ≥ -1 • Because 0≥ x2 - 1, • x2 - 1 must be a negative number or 0 • a negative number is the product of • a positive & negative # -1 ≤ x ≤ 1 • one of the factors must be positive and the other negative If ab < 0, then a < 0 and b > 0, or a > 0 and b < 0.
EXTRANEOUS KEY WORD - “and” Solve 0 ≥ x2 - 1 algebraically (con’t) x2 - 1 ≤ 0 Set quadratic = 0 (x - 1)(x + 1) ≤ 0 Factor (x - 1) ≥ 0 (x + 1) ≤ 0 (x - 1) ≤ 0 (x + 1) ≥ 0 and and x ≥1 x ≤ -1 x ≤ 1 x ≥-1 and and What values of x can satisfy both inequalities for each set? x CANNOT be a number less than or equal to -1 and greater than or equal to 1. “What values of x are less than or equal to 1 and greater than or equal to -1?” -1 ≤ x ≤ 1
Aim: How do we solve quadratic inequalities? Do Now: Graph the inequality y ≥ x2 – 1