CHAPTER 3 ATMOSPHERIC PRESSURE
CHAPTER 3 ATMOSPHERIC PRESSURE. KMWH 121552Z 16004KT 4SM -RA BR FEW043 OVC055 01/01 A2974 RMK AO2 RAE04B28UPB04E28 SLP081 P0005 T00060006 KMWH 121507Z 1215/1312 VRB03KT 6SM -SHRA BR BKN035 FM121800 VRB03KT P6SM VCSH BKN015 OVC100 FM130100 32005KT 5SM -SHRA BR SCT006 OVC010

CHAPTER 3 ATMOSPHERIC PRESSURE
E N D
Presentation Transcript
KMWH 121552Z 16004KT 4SM -RA BR FEW043 OVC055 01/01 A2974 RMK AO2 RAE04B28UPB04E28 SLP081 P0005 T00060006 • KMWH 121507Z 1215/1312 VRB03KT 6SM -SHRA BR BKN035 FM121800 VRB03KT P6SM VCSH BKN015 OVC100 FM130100 32005KT 5SM -SHRA BR SCT006 OVC010 • KEPH 121553Z AUTO 35004KT 10SM -RA BKN055 OVC070 03/02 A2972 RMK AO2 SLP075 P0000 T00280022 • http://www.avcanada.ca/forums2/viewtopic.php?f=54&t=70372
Weight of Earth’s Atmosphere • Given: Weight per square inch = 14.7 lbs • Given: Earth’s surface area = 196,000,000 sq miles (statute) • Weight per square foot = 2116.8 lbs or 1.0584 tons • Weight per square mile = 29,506,498 tons • Total weight of atmosphere = 5,783,000,000,000,000 tons
Volume of Earth’s Atmosphere • Given: 99% is contained within 31 miles of the surface • Total volume = 6,076,000,000 cubic miles
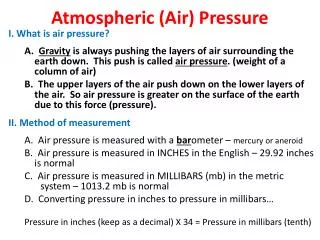
ATMOSPHERIC PRESSURE • Evangelista Toricelli who was a student of Galileo invented the barometer in 1643. • There are 2 common types of Barometers: Mercurial and Aneroid (without liquid) Wafer type. • Baro =Greek for weight • Aneroid = not wet
BAROMETERS • Any instrument that measures pressure is called a barometer • Aneroid Barometers work similar to Altimeter
BAROMETERS • Mercury Barometers need to be corrected before any of the pressure readings can be used for maps. • Elevation must be corrected (set for sea level) • Temperature (corrected to 0 degrees C) • Acceleration of gravity (45 degree latitude) http://www.engineeringtoolbox.com/acceleration-gravity-latitude-d_1554.html
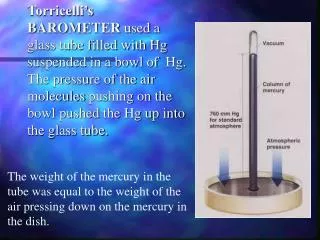
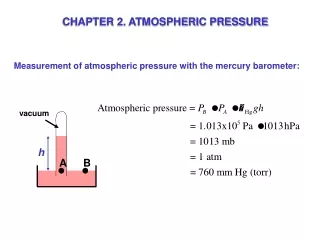
MERCURY BAROMETERS • Atmospheric pressure forces mercury from the open dish upward into the evacuated glass tube. The height of the mercury column is a measure of atmospheric pressure.
MERCURY BAROMETERS • Standard sea level pressure = 29.92 inches of mercury or 1013.25 hectopascals (=millibars) • pressure = force per unit area
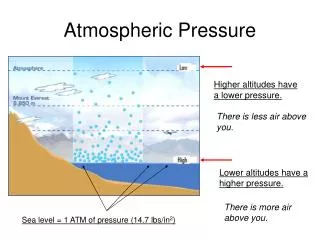
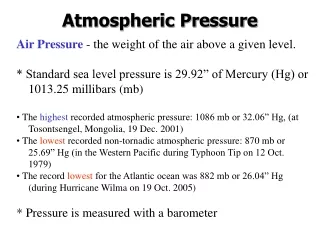
AIR HAS WEIGHT • Air is heavy. It is a lot heavier than most people realize. One cubic yard of air at sea level pressure and at a temperature of 70 F weighs almost exactly 2 pounds. The air in a room 12 ft x 14 ft with an 8-foot ceiling weighs almost exactly 100 pounds. • To come to the point quickly, the average air pressure at sea level is about 14.7 psi. It varies from day to day, but this is the average pressure in pounds per square inch, in round numbers.
Water barometer • Water can be used as the liquid to make a pretty good barometer, but there is a practical difficulty in that the arms of the U tube need to be about 34 feet long. That is, atmospheric pressure is able to push a column of water upward a distance of 34 feet above the level at which the pressure is applied. • The first barometer was developed by Evangelista Torricelli in 1643, in the era of Issac Newton. One of his earlier models used water as the liquid. Story has it that he mounted the thing (34 feet tall) in the village square so the townspeople could see it. But they made him take it down because every time the liquid dropped down, the weather turned bad. And they didn't need any more bad weather. • After Mr. Torricelli had developed a workable and portable mercury barometer, he and his friends read the thing very carefully while down in the valley, and then carried it up to the top of a nearby mountain. Ahh ha! The barometer indicated a lower pressure at the top of the mountain than it did down in the valley. This gave the first indication that the atmosphere of the earth had a finite depth rather than extending upward forever. • Atmospheric pressure = 14.7 psi = 30 in/Hg = 34 feet of water • All these numbers are approximate, of course.
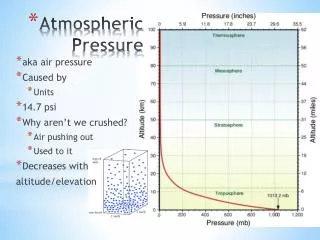
PRESSURE VARIATION • Pressure Varies with • Altitude - Pressure drops at an average of 1 inch/ 1000’ as we go up in the atmosphere • Also with: Temperature
Approximately 1 inch per 1000ft • Here is a table that gives the atmospheric pressure at various altitudes. The altitude is given in feet and the pressure is in inches of mercury. • AltitudePressureAltitudePressure • 0,000 29.92 20,000 13.75 1,000 28.86 25,000 11.10 2,000 27.82 30,000 8.886 • 3,000 26.82 35.000 7.041 4,000 25.84 40,000 5.538 5,000 24.89 45,000 4.355 • 10,000 20.58 50,000 3.425 15,000 16.88 60,000 2.118 18,000 * 14.94 100,000 0.329 • * This is almost exactly one-half the sea-level value. To convert in/Hg to psi, multiply by 0.491. • It is interesting to note that the pressure drops to one-half its sea-level value at about 18,000 feet. The implication is that one-half of all the mass of the atmosphere lies below this altitude. Further, almost (but not quite) a third of the total lies below 10,000 feet. • http://www.challengers101.com/Pressure.html
Average decrease in pressure/1000ft • Average decreaseAltitude Rangeper 1,000 feetFeet per in/Hg • Sea level to 5,000 ft 1.006 in/Hg 994 5,000 to 10,000 0.862 1,160 10,000 to 15,000 0.740 1,350Sea Level to 10,000 ft 0.934 1,070 • At atlitudes below 5,000 feet, you won't be in error too much is you simply say 1 in/Hg per 1,000 feet, or, 1,000 feet for each change in pressure of 1 in/Hg. Or even, 10 feet for each 0.01 change in pressure.
Stations then take the local pressure and plot it on maps to follow the pressure patterns.
LOW PRESSURE • Low = center of pressure surrounded on all sides by higher pressure also called a cyclone. Cyclonic • rotates counterclockwise • area of rising air • usually clouds present • bad weather
HIGH PRESSURE • High = a center of pressure surrounded on all sides by lower pressure also called an Anticyclone. Anticyclonic • rotates clockwise • area of descending air • usually no clouds • good weather
Other PRESSURE Definitions • Trough - an elongated area of low pressure with the lowest pressure along a line marking maximum cyclonic curvature. • Ridge - an elongated area of high pressure with the highest pressure along a line marking maximum anticyclonic curvature.
Other PRESSURE Definitions • Col = the neutral are between two highs and two lows (like a mountain pass on a map
Surface/Upper Air Maps • We will discuss more in detail latter on. • You can find many different kinds of weather maps for different pressure analysis. • 250, 500, 700 etc… • These charts can be very useful in determining the weather at specific altitudes • Example 700mb chart is approximately 10,000 ft MSL
ALTIMETRY • The Altimeter is basically an aneroid barometer (measures height) • Indicated altitude - read off a correctly set altimeter • Pressure altitude - altitude of the 29.92” line or read off altimeter when set to 29.92 • Density altitude - pressure altitude corrected for nonstandard temp.
ALTIMETRY • Absolute altitude - the height above the surface (AGL) • True altitude - actual altitude above sea level
TEMPERATURE • Causes an airmass to expand or contract • This however does not necessarily effect pressure with a given volume of air • therefore the pressure line will be higher when warmer • the pressure line will be lower when colder
INDICATED ALTITUDE • Temperature affects indicated altitude • Cold temperature correction charts
DENSITY ALTITUDE • High Density altitude refers to height not density. Gives: • reduced power • reduced thrust • reduced lift • Use the same airspeeds but ground speed is higher
ICAO cold temperature error table • http://www2.faa.gov/airports_airtraffic/air_traffic/publications/ATpubs/AIM/Chap7/aim0702.html
PRESSURE CHANGES IN FLIGHT (read Pages 18-19) • When flying from High to Low “Look out below” • When flying from Low to High “High in the sky” • Above 18,000 feet the altimeter is set to 29.92 and only pressure altitudes are flown
Chapter #3What causes a L or H pressure? 1 • Temperature • In a closed container more temp = more pressure • You might think that the higher the temp the higher the pressure • But No!
What causes a L or H pressure? 1 • Usually the highest pressures are found in cold regions • Why? • Because of Density • Usually the higher density offsets the lack of movement of the molecules
What causes a L or H pressure? 2 • Convergence • movement of air aloft is not always at the same speed • where it slows down it piles up into a High pressure • the piling up of air is called convergence
What causes a L or H pressure? 3 • Divergence • opposite of convergence • the upper level wind speeds up and stretches the air out creating a Low pressure • usually good wx under an upper level divergence
What causes a L or H pressure? 4 • Thermal tides • At an average altitude of 60 mi (thermosphere) changes of over 500ºC • the rapid warming and cooling of upper air causes great density oscillations • shows up as small pressure changes at the surface because of the high altitude
WIND • Differences in temperature create differences in pressure. These pressure differences drive a complex system of winds in a never ending attempt to reach equilibrium. Wind also is a transportation device for water vapor and cloud condensation nuclei.
CONVECTION • Warm air rises • Cold air sinks • With convection, warm air rises cools then sinks. Uneven surface heating. • The wind sets up an advection process whereby the cool air is blown along the ground until it is warmed then it rises again and repeats the process.
PRESSURE GRADIENT • Pressure gradient = difference in pressure / distance • Sets up a flow from high to low • The closer the isobars, the stronger the pressure gradient force and the stronger the wind
PRESSURE GRADIENT • Think of a Topographical map. If you’re a ball on the top of a steep mountain (high pressure system) and you roll off into the low lying are below (low pressure system) the steeper the gradient the faster the wind.
CORIOLIS FORCE • This force describes the apparent force due to the rotation of the earth • All free moving objects such as ocean currents, artillery projectiles, air molecules and aircraft seem to deflect from a straight line path because the earth rotates under them.
On this non-rotating platform the ball travels in a straight line from one guy to another On this counter-clockwise rotating platform the ball seems to veer to the right from the perspective of the persons on the platform
CORIOLIS FORCE • Flow would normally be 90º to isobars except for Coriolis Force • Causes a deflection of winds to the right in the Northern Hemisphere • To the left in the Southern Hemisphere • The deflection turns the winds parallel to the isobars at altitude • Near the ground, the deflection depends on surface friction