Download
1 / 15
150 likes | 402 Vues
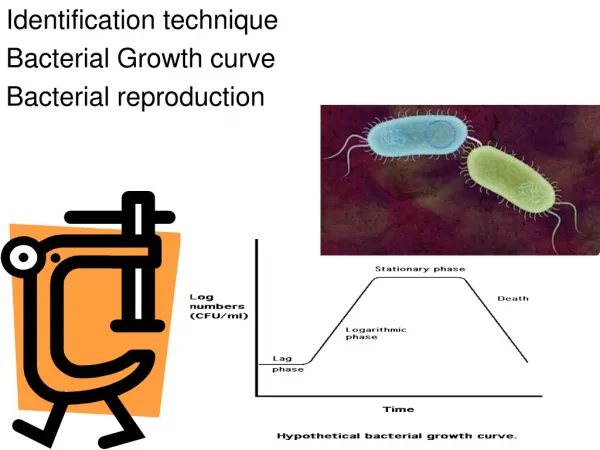
Investigating Bacterial Growth. Reproduction. Bacteria reproduce asexually by binary fission Single chromosome replicates & then cell divides Rapid All new cells identical (clones). Cellular organism copies it’s genetic information then splits into two identical daughter cells.

E N D
Reproduction • Bacteria reproduce asexually by binary fission • Single chromosome replicates & then cell divides • Rapid • All new cells identical (clones)
Cellular organism copies it’s genetic information then splits into two identical daughter cells
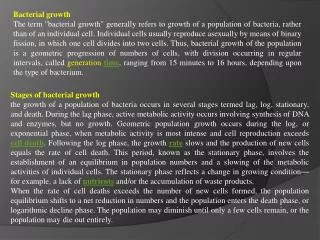
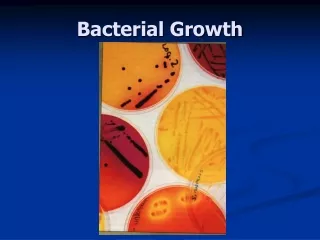
The Four Stages of Bacterial Growth • Lag Phase An adjustment period when the bacteria are switching on or off different machinery necessary to break down the energy source within the immediate environment. 2. Log Phase Rapid growth of bacteria at an accelerated pace. • Stationary Phase Equal rate of growth and death so that overall bacterial numbers stay the same. • Death Phase Rapid cell death usually due to the cells bursting open, also known as cell lysis.
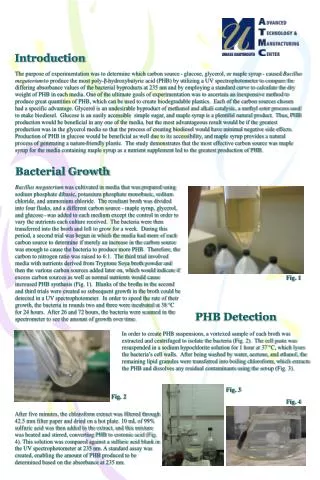
The Optical Density (OD) of Bacterial Culture OD is the amount of light that is able to pass through a liquid culture. The more bacterial cells in a culture, the denser the culture. This means that less light is able to pass through the sample.
Purpose • Follow the growth of your bacterial culture by measuring the change in the absorbance (O.D.) reading over time.
4. Label Cuvettes • + • -
5. Put 1.5 ml of the diluted bacteria into + cuvette. Pipette 1.5 ml of sterile media into the - cuvette.
Go to the spectrophotometer and set the absorbance to 600 nm by pressing the “nm” button. Insert the “-” sample and hit the “0ABS/100%T” button. Record the absorbance (O.D.) of bacterial sample in the table. Save the - cuvette, but rinse out the cuvettes with the bacteria into the bacterial waste container. Keep the cuvettes for the next reading. After 20 min, 40 min, 60 min, and 80 min, blank the spectrophotometer again. Pipette out 1.5 ml of growing bacterial culture into the cuvette and take a reading. Record in the table.
How to Graph Bacterial Growth Using semi-log paper, OD values from the spectrophotometer are combined to show a growth curve with respect to time. This is an example of what a growth curve looks like. Stationary Phase Log Phase OD635 Death Phase Lag Phase Time
Discussion • Explain what your graph shows in terms of bacterial growth. • Does your line look like the typical growth pattern for bacteria? If not, explain why.