Download
1 / 19
190 likes | 477 Vues
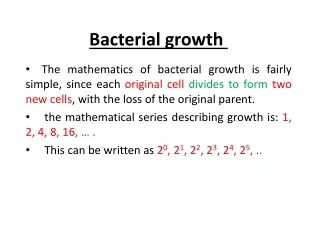
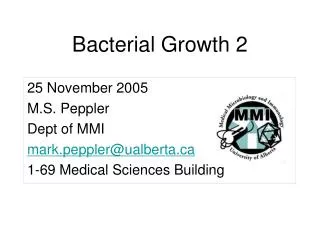
25 November 2005 M.S. Peppler Dept of MMI mark.peppler@ualberta.ca 1-69 Medical Sciences Building. Bacterial Growth 2. Bacterial Growth 2. Objectives. After today’s session you will understand: 1. The factors that influence the specific growth rate, k .

E N D
25 November 2005 M.S. Peppler Dept of MMI mark.peppler@ualberta.ca 1-69 Medical Sciences Building Bacterial Growth 2
Bacterial Growth 2 Objectives. After today’s session you will understand: 1. The factors that influence the specific growth rate, k. 2. The characteristic stages of bacterial growth (in broth). 3. The effect of growth-limiting parameters on bacterial yield. 4. The effect of gene regulation on growth.
Objective 1a. Factors influencing k. Recalling Mama Julia’s yogurt from last time, How could you INCREASE shelf life??? (General discussion, not strictly limited to “L. stinko”).
Objective 1b. Factors influencing k. N.B: growth rate is not a fixed number for a species: it varies depending on conditions: e.g., at colder temp, k is lower. k = 4 h-1 at 37°C Log CFU k = 0.4 h-1 at 10°C Time
Objective 1c. Factors influencing k. k also depends on the nutrients supplied: e.g. rich medium versus minimal medium for E. coli. k = 2 h-1 in TSB Log CFU k = 0.2 h-1 in glucose-minimal salts Time
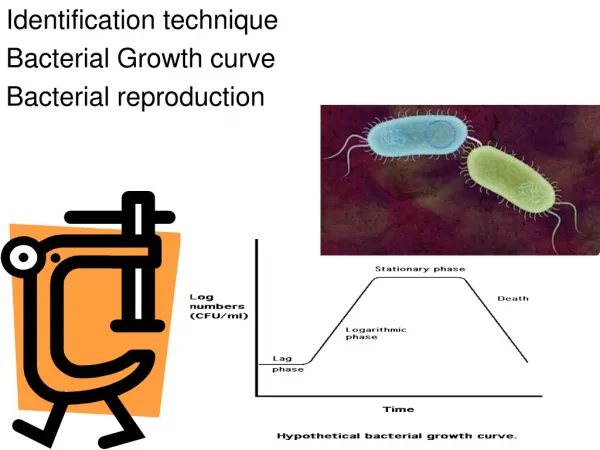
Objective 2a. Population Growth Curve. Everything described so far relates ONLY to the period of unlimited, exponential growth This can be a relatively short period of time for a culture, and it certainly does not continue forever (remember the "battleship of E. coli"). WHAT HAPPENS THE REST OF THE TIME?? e.g., when you inoculate a tube of TSB medium with E. coli in the lab….??
Objective 2b. Population Growth Curve. maximum k, minimum g and the only phase where the growth equation applies.
Objective 2b. Population Growth Curve. • LAG phase: • Individual cell SIZE increases in preparation for division; • Cells are adjusting to medium, making ribosomes, replicating DNA but haven't divided yet. ("move into the neighborhood, unpack the TV, find the grocery store"). High metabolic activity.
Objective 2c. Population Growth Curve. LOG or EXPONENTIAL phase: cells are growing at maximum (exponential) rate (i.e., maximum “k”, minimum “g”) for the given conditions of temperature and nutrients supplied. (“party time!”) ******This is the only phase where Nt = N02n and growth equation apply*******
Objective 2d. Population Growth Curve. STATIONARY phase: cells have exhausted nutrients and have built up toxic wastes in the closed system; i.e. this is no longer unlimited growth growth rate slows; generation time increases ("nothing left to eat except the cheese on the bottom of the pizza boxes").
Objective 2e. Population Growth Curve. DEATH phase: number of dying cells exceeds number of dividing cells. The number of viable cells decreases. (“there goes the neighborhood”). "Autolysis" (i.e., lysis of the dying cells through actions of cell wall damaging enzymes) may occur.
Objective 3a. Growth conditions and cell yield. Cell Yield: (The maximum number of cells that can be produced in a medium). Typically occurs in late log/early stationary. 37°C Equivalent yield of cells Log CFU 20°C Slower growth rate, longer lag time. Time
Objective 3b. Growth conditions and cell yield. • However, cell yield IS affected by medium composition. • e.g., TSB vs. mineral + glucose salts medium: • nutrients are supplied vs. the energy demand required for synthesis of monomers and macromolecules, etc. TSB Log CFU Glucose-minimal salts Time
Objective 3c. Growth conditions and cell yield. Different strengths of the same medium will give different cell yields, but the samek values and same lag duration (usually). 1 X 0.5 X Log CFU 0.3 X 0.1 X Time
Objective 3d. Growth conditions and cell yield. • e.g. Dr. Phil Fedorak had a research contract to detect and quantify trace organic compounds in drinking water. The compounds were in mixtures too complex and far too dilute to measure accurately chemically, so they developed a BIOASSAY to indicate the water quality, as follows: • 1) Select a Pseudomonas species which grows in very dilute medium (a good “scavenger” of organic carbon) • Prepare a STANDARD CURVE to relate Organic Carbon (OC) content of the medium to cell yield • • Put tiny, known amounts of organic C into distilled water, • • Inoculate with a standardized inoculum size, • • Incubate until stationary phase is reached (“time X” pre- determined in the lab with plate counts). • At this point, cell yield is maximum for the given conc. of organic C.
Objective 3e. Growth conditions and cell yield. BIOASSAY to indicate the water quality, as follows: Experimental Data Standard Curve Measure cell yields at X hours 1 nm OC Log CFU Cell yield at X hours 0.5 nM OC 0.1 nM OC X Time [Organic C] Now you can do the actual testing: 1) Bring drinking water samples to the lab, 2) inoculate with standard inoculum, 3) incubate under standard conditions of temp., etc. 4) after X hours, measure cell yield (e.g., by plate counts) 5) look up cell yield on standard curve and read the Organic Carbon content off the graph.
Objective 4a. Effect of gene regulation on growth. Another factor affecting the population growth curve is gene regulation: e.g., catabolite repression and diauxic growth Recall: catabolite repression is a form of global control. cAMP and CAP interact to activate certain genes. Therefore, lack of activation by cAMP+CAP means that those genes are NOT expressed. This is observed in the phenomenon of diauxie (diauxic growth), defined as growth of a species strictly on a preferred C source even in the presence of a secondary C source. Check out this site for a great demo:http://www.rpi.edu/dept/chem-eng/Biotech-Environ/GrowPresent/diauxie.htm
4. Log phase during growth on lactose 2. Log phase during growth only on glucose; [cAMP] is low because energy status of cell is high; therefore glycolysis occurs but lac operon is not induced because there is a high kG value until glucose is exhausted, when [cAMP] increases and can bind CAP. 5. Stationary and death phases 3. Lag phase during expression of lac operon 1. Lag phase Objective 4b. Effect of gene regulation on growth. Diauxie is observed in E. coli with glucose (preferred C source) and lactose (secondary C source) as illustrated below with the screen capture from Renesselaer Polytechnic Institute. Even if BOTH C sources are present at the same time, the E. coli will grow using the glucose only, until the glucose is gone. Only then will it synthesize the genes (lac operon) to utilize the lactose as a secondary C source.
Next time: Death to Microbes!