Download
1 / 1
10 likes | 91 Vues
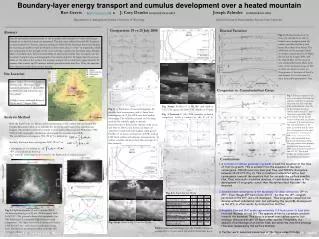
Study of mass, sensible heat, and latent heat convergence over mountain range, focusing on diurnal variation and effects on cumulus cloud development.

E N D
1900Z 2010Z 2220Z 2120Z Fig. 2: (a) Evolution of mass convergence, (b) sensible heat convergence, and (c) latent heat convergence on 19 July 2006 over the Catalina Mountains. The solid line is based on 10 surface stations, the symbols apply to aircraft measurements at three levels. Sunrise, solar noon, and time of first Cu are shown. (d) mean (or ‘advective’) wind (red) and anabatic wind speed.. Profiles of (e) mass convergence, (f) SHC, and (g) LHC from surface and airborne measurements. (h) surface sensible and latent heat flux (average of 4 flux stations).. Fig. 3(top): Profiles of θ, θe, θe*and wind at 1532 UTC (grey) and 2000 UTC (black) on 19 July. Fig. 3 (bottom):19 July 2006 cumulus evolution snapshots from a camera at the U of A. 1810Z 1910Z 2130Z 2020Z Fig. 5(top): Same as Fig. 3, but for 25 July. Boundary-layer energy transport and cumulus development over a heated mountain Bart Geerts(geerts@uwyo.edu) & J. Cory Demko(coryuw@uwyo.edu)Joseph Zehnder(zehnder@asu.edu) Department of Atmospheric Science, University of WyomingGlobal Institute of Sustainability, Arizona State University Comparison: 19 vs 25 July 2006 Diurnal Variation Abstract Fig. 6: Diurnal variation of (a) mass, (b) sensible heat, and (c) latent heat convergence and (d) surface sensible (red lines) and latent (blue lines) heat fluxes. The solid lines are the averages based on surface station data for 16 flight days in July & August 2006, and the dashed lines are the mean ± one standard deviation. Data from each of the 24 aircraft loops at 300 m AGL are shown as stars. (e) Histograms of the time of first Cu and deepest Cu on the same 16 days, from photogrammetric data. Aircraft and surface measurements of the boundary-layer transport of mass and energy towards an isolated mountain are presented. The data were collected around Mt. Lemmon located northeast of Tucson, Arizona, during the 2006 North American monsoon. During the morning an anabatic wind developed on most days, about 1-2 ms-1 in magnitude, which was comparable to the strength of the mean advective wind in the boundary-layer. During times of anabatic flow, the horizontal influx of latent and sensible heat (averaged over the mountain footprint area, and integrated of the inflow depth) is far larger than the vertical influx of the same at the surface. On average, anabatic flow commences approximately 90 minutes after sunrise and 10 minutes behind upward sensible heat flux. Thus, the anabatic flow observed needed little surface heating. Site Location Santa Catalina Mountains, north of Tucson, AZ. This range has a maximum elevation of about 2800 m (9000 feet) and referred to as a “sky island.” 16 flights were conducted between 18 July and 17 August 2006. Congestus vs. Cumulonimbus Cases Fig. 7: Diurnal variation of (a) mass convergence between days with Cb and with Cu congestus only (non-Cb). The solid line (Cb) and dashed line (non-Cb) are the averages based on surface station data for 7 and 9 flight days respectfully. Data from each of the 24 aircraft loops at 300 m AGL are shown as triangles (Cb) and stars (non-Cb). Vertical profiles of (b) mass (c) sensible and (d) latent heat convergence for the same days with blue indicating Cb and orange congestus-only. The solid and dashed lines represent the average profile. The two surface measurements represent the timed average ISFF measurements between 16 and 22 UTC. The dotted profiles are vertical velocity derived from convergence. Analysis Method Both the flight loops (ex. below) and the positioning of the surface stations around the Catalina Mountains allow us to calculate the mountain-wide mass, heat, and moisture budgets. The method used here is similar to that used by Raymond and Wilkening (1980, 1982) for dry orographic circulations and orographic cumulus respectfully. The sensible heat convergence SHC (W m-3) is defined as: Similarly, the latent heat convergence LHC (W m-3) is: Convergence (s-1) is defined as: = area enclosed by the loop = anabatic wind component normal to the flight track or station polygon. Conclusions • A toroidal circulation generally is present around the mountain at the time of first Cu growth. This is evident from the sequence of low-level convergence, 780 hPa near-non-divergent flow, and 700 hPa divergence, between 18-20 UTC (Fig. 2). This circulation is associated with a heat convergence towards the mountain that far exceeds the surface sensible flux. Thus, once such circulation develops, it contributes far more to the development of orographic cumuli than the surface heat flux over the mountain. • Sensible heat convergence is not necessary for deep convection. 19th vs. 25th – Even though 25th had a mean SHC 5 – 6x than the 19th, congesti persisted on the 19th, and a Cb developed. Thus orographic convection can develop without substantial SHC, but instead by the local CBL development up the LFC, in other words, by local positive SH Flux. • Anabatic flow and SHC peaks approximately 2-3 hours prior to local solar noon and the peak in local SH. This appears driven by a pressure gradient towards the mountain. This force is present even before sunrise, but drainage flow prevails until 1.5 hours after sunrise. Presumably the anabatic flow develops at an earlier time, but above the very thin drainage flow layer measured by the surface stations. • Further work: numerical simulations of the three cases (EULAG). p’ Fig. 4:As Fig.2, but for 25 July. Fig. 1. Flight-level winds, q, and r on three WKA circumnavigation legs on 25 July 2006 between 16:00 – 16:50 UTC. The grayscale shows the topography (m). The WKA track is colored by flight-level potential temperature. The flight-level wind is shown with barbs; a full barb is 5 ms-1 and colored based upon mixing ratio. Met stations are shown in white and eddy flux towers in yellow. T’ Table 1: Mass and heat fluxes over the Catalina Mountains averaged for a 4 hour period centered on local solar noon.