Download
1 / 36
360 likes | 583 Vues
Measuring Inflation Accurately and Effectively. Erica L. Groshen, BLS Commissioner Conference on Inflation, Monetary Policy, and the Public Federal Reserve Bank of Cleveland May 30, 2014. Agenda. What goes into the Consumer Price Index? Idea is simple, execution is not ! Goal and uses

E N D
Measuring Inflation Accurately and Effectively Erica L. Groshen, BLSCommissioner Conference on Inflation, Monetary Policy, and the Public Federal Reserve Bank of Cleveland May 30, 2014
Agenda • What goes into the Consumer Price Index? • Idea is simple, execution is not! • Goal and uses • Scope and coverage • Classification system • Weighting • Sampling • Data collection • Estimation • Publication
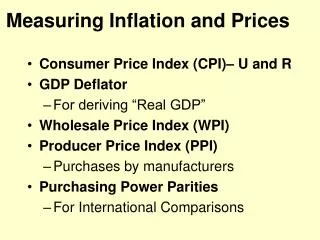
CPI GOAL:Measure “Cost of Living” • In words: CPI seeks to measure the change in the cost of living by measuring • Prices paid by consumers • In urban areas of U.S. • For a market basket of goods and services • Purchased by “average consumer” • For consumption
Uses: Why should price change measures be produced by impartial agencies like BLS • BLS price measurement dates to 19th century • Purpose: Help quell industrial unrest • Now used for monetary policy, union contracts, SSA payments, school lunch prices, Federal income tax brackets, Federal civil service pensions, SNAP benefits, TIPS bonds… • Inflation measures have major personal, business, policy and fiscal ramifications • Credibility of data enhanced when produced by agencies insulated from partisan politics
Scope: Geography • 87 areas represent urban population • 89% of US population • Combined into 38 distinct units
Weighting • “Market basket” = set of goods and services • Represents everything actually purchased • By the average consumer • Expressed as share of total spending • Used to weight a set of price changes to get an average price change • Prices don’t move lock-step in a market economy • Source of market basket (i.e., CPI weights): Consumer Expenditure Survey
How BLS gets weights • Consumer Expenditure Survey is two separate surveys • Quarterly interviews ask about major purchases • Consumer diaries of all purchases over two single 2-week periods • CPI weights updated every two years • Current weights from 2011-12 • One weight for each of 211 item-categories
Classifications • 211 item-categories aggregated into 8 major groups • Or, just 3: • Food • Energy, and • All items less food and energy • Food And Beverages • Housing • Apparel • Transportation • Medical Care • Recreation • Education and Communication • Other Goods and Services
Price data collection • Where does BLS price items? • Telephone Point-of-Purchase Survey (TPOPS) • Household surveys in each of 87 areas • Used to select outlets for price collection • How do we collect prices? • Field Representatives visit outlets • Use Computer Assisted Data Collection • Select and price items using probability sampling • Items described completely in terms of price-determining characteristics
Sample rotation • Sample rotation allows sample of specific items in CPI to stay up-to-date • Allows, e.g., particular cell phones or automobiles in CPI sample to be representative of what consumers are buying • Outlet/item sample replaced every four years • 1/8th of sample every 6 months
Role of CPI field staff • Price sought • Retail transaction price • Paid by consumer • Including sales and excise taxes • Each month, CPI field staff • 400 PT and 100 FT economists and assistants • Visit >23,000 outlets in 87 cities • Collect prices over 83,000 individual items (around a million prices/year)
Calculating CPI • Stage 1: Construct “basic indexes” 211 Item-categories x 38 Geographic units 8,018 Basic item-area indexes • Stage 2: Aggregate basic indexes into broader indexes using weights from CE • Highest level (headline): All Items U.S. City Average • Lower levels: By area or by item category
Limitations • No consumer is “average” • Individuals and households purchase unique market baskets, so inflation experiences can differ from CPI • E.g., spending patterns of subgroups, such as elderly, may differ from CPI-U “average”
CPI measures • CPI-U: Reflects spending patterns of all urban consumers • CPI-W: Reflects spending patterns of all urban wage earners and clerical workers • CPI-E: Experimental index reflects spending patterns of the elderly (ages 62+) • C-CPI-U: Chained CPI • Same population as CPI-U • More current expenditure data and different formula
Concern about “substitution bias” • Consumers change spending behavior over time • Some choices are responses to price changes • CPI-U and CPI-W based on spending patterns a few years old • Can cause “substitution bias” in CPI when relative prices change • Within item-area cells (one type of apple for another)— eliminated with 1999 formula change • Across item-areas (chicken for steak or airfare for gasoline)—still present in CPI-U and CPI-W
Addressing substitution across item-categories • Chained-CPI-U • Created in 2002 • Uses updated spending patterns and Tornqvist formula • Initially issued as an estimate and revised twice afterwards • Final C-CPI-U • Nearly free of substitution bias • Reflects current consumer spending behavior
Publication Pu Transmission of material in this release is embargoed until 8:30 a.m. (EDT) Thursday, May 15, 2014 Technical information: (202) 691-7000 • Reed.Steve@bls.gov • www.bls.gov/cpi Media Contact: (202) 691-5902 • PressOffice@bls.gov CONSUMER PRICE INDEX – APRIL 2014 The Consumer Price Index for All Urban Consumers (CPI-U) increased 0.3 percent in April on a seasonally adjusted basis, the U.S. Bureau of Labor Statistics reported today. Over the last 12 months, the all items index increased 2.0 percent before seasonal adjustment. The indexes for gasoline, shelter, and food all rose in April and contributed to the seasonally adjusted all items increase. The gasoline index rose 2.3 percent; this led to the first increase in the energy index since January, despite declines in the electricity and fuel oil indexes. The food index rose 0.4 percent for the third month in a row, as the index for meats rose sharply.
History of CPI • One hundred years of price change: the Consumer Price Index and the American inflation experience • Monthly Labor Review, April 2014 • For 100 years now, the Consumer Price Index has measured price change in the U.S. economy. Breaking the 100-year period into several distinct subperiods, this article examines major patterns and trends in price change during each one and highlights notable features of the CPI data. Also discussed are the reaction of the public and policymakers to the inflation of the day and the inflation experience of Americans in each subperiod.
Current CPI research topics • CPI’s new estimation system will improve flexibility • More research and faster innovation • Redesign of CE survey will improve data quality and reduce burden on respondents • “Big data” offers alternative means for • Quality information • Price collection • Spending and outlet surveys
Final thoughts • Measuring inflation is complicated but important • Trust is key • Objective, skilled, transparent agency • So is accessibility • Public releases; equal access • Follow inflation and other indicators on www.BLS.gov and on Twitter @BLS_gov • And…
Thank You! • To the businesses and households who participate in BLS surveys • To the conference organizers for providing vital, informed discourse about inflation and current economic issues
Erica L. GroshenCommissioner202-691-7800groshen.erica@bls.gov
Observations as BLS Commissioner • BLS has a special, strong pact with the American people • We work hard to achieve exceptional voluntary cooperation from firms and families • BLS staff honors and works to uphold public trust • Transparent methods and trusted products • Legal and procedural protections
Priorities for BLS • Data goals: Accurate, Objective, Relevant, Timely and Accessible • Provide data as a pure public good • Like roads and clean air • Help nation’s policymakers, businesses, and families make good decisions • Get best we can for Nation’s data dollar
Appendix: CPI formulas • The Laspeyres formula holds quantity constant, assuming no substitution, and by construction is an upper bound to the change in the cost of maintaining a standard of living. • The Laspeyres formula is used at the lower level in categories where substitution would be difficult or unlikely, such as medical care services • The Laspeyres formula is used at the upper level in the aggregation of basic indexes (except in the C-CPI-U); thus there is an assumption of no substitution between fruits and vegetables or gasoline and airline fares
Appendix: CPI formulas Laspeyres formula: (R is the price relative, P0 and Q0 are base period prices and quantities, Pt is current period price)
Appendix: CPI formulas • The geometric means formula holds relative expenditure constant, implicitly assuming a unitary elasticity of substitution. • It is used for most items at the lower level since 1999
Appendix: CPI formulas • Geometric means formula: (R is the price relative, P0 and Q0 are base period prices and quantities, Pt is current period price, S is the share of the total weight for the item) • Total product of ratio of current price to base month price raised to the power of item’s share