Download
1 / 38
390 likes | 790 Vues
INFLATION AND TYPES OF INFLATION. Md. Nuruzzaman, PhD Director (Training), NAPD. Inflation. Definition: Is a steady an upward movement in the level of prices decreasing purchasing power over a period of time, usually one year. Measuring Inflation.

E N D
INFLATION AND TYPES OF INFLATION Md. Nuruzzaman, PhD Director (Training), NAPD
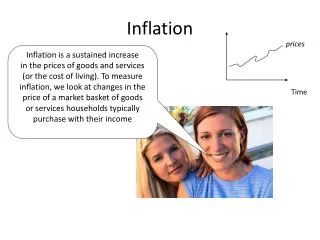
Inflation • Definition: • Is a steady an upward movement in the level of prices decreasing purchasing power over a period of time, usually one year.
Measuring Inflation • The Consumer Price Index (CPI) is the official measure of inflation.
Measuring Inflation • The CPI can be thought of as an imaginary ‘basket’ of selected goods and services bought by a typical capital city household. • The CPI is merely a measure of the changes in the price of this basket of goods and services.
Measuring Inflation • The price of the CPI basket in the base (first) period is given a value of 100 and the prices of subsequent periods are compared against the base year.
Measuring Inflation • For example, if the price of the basket had increased 15% since the base year, the CPI would read 115, if the price had fallen by 15% since the base year the CPI would be 85.
Measuring Inflation • It is important to remember that the CPI measures price movements and not actual price levels.
Measuring Inflation • For example, if the index for beer is 108 and the corresponding index for wine during the same period is 104 it doesn’t mean that the price of beer. Is more expensive than wine.
Measuring Inflation • It means that the price of beer has increased twice as much as that of wine since the base year.
Measuring Inflation • Compilation of the CPI involves a quarterly survey of a ‘basket’ of goods and services representing a high proportion of household expenditure.
Measuring Inflation • The basket of goods and services upon which the CPI is based is divided into 8 groups. Which are further divided into a number of sub-groups and then into specific expenditure classes.
Measuring Inflation • The eight groups of the CPI are as follows: • Food • Clothing • Housing • Education and Recreation • Transportation • Tobacco and Alcohol • Health and Personal Care • Household Equipment and Operation
Measuring Inflation • To reflect the importance of each expenditure class in relation to total household expenditure, weight or measure of relative importance to each expenditure class in the CPI, are attached to each item in the index.
Measuring Inflation • Weights are compiled as a result of extensive surveys of patterns of consumption and are revised every 5 years to take account of changes in expenditure patterns.
Measuring Inflation • The usefulness of an index number in statistics is to allow comparisons of data between one period and another, using a common unit of measurement.
Calculating Inflation Year 2 cost x 100 = Therefore Year 1 cost 1 90 x 100 = 112.5 80 1
Calculating Inflation • 112.5 – 100 (Base Year) = 12.5 % • From this we can say over the year, average prices increased by 12.5 %.
Inflation • Inflation is a steady and upward movement in the level of prices, decreasing purchasing power, over a given period of time, usually one year.
Demand Pull Inflation • Demand Pull Inflation occurs when Aggregate demand (C+I+G+(X-M)) increases at a rate faster than the capacity of the economy to produce goods and services ie: AD>AS. This increase competition for goods and services drives up their prices.
Demand Pull Inflation Price $ Aggregate Supply P2 Aggregate Demand 2 P1 Aggregate Demand 1 Q1 Q2 Real GDP ($)
Demand Pull Inflation • An increase in demand shifts the aggregate demand curve to the right, from AD1 to AD2 pushing up the price level from P1 to P2.
Sources ofDemand Pull Inflation • Any increase in Aggregate Demand (C + I + G + ( X – M ) ) as the economy approaches full employment.
Sources ofDemand Pull Inflation • Full employment causes labour shortages, employers thus bid up wages to attract labour. The increased income, transpires into increased consumption causing Aggregate Demand to rise.
Sources ofDemand Pull Inflation • High levels of foreign investment increases employment, income, consumptions and ultimately Aggregate Demand.
Sources ofDemand Pull Inflation • Growth in foreign economies can lead to higher incomes for our exporters, thus allowing increases in Aggregate Demand.
Sources ofDemand Pull Inflation • Inflationary expectations – If members of an economy expect prices to rise, it brings forward expenditure decisions leading to demand pull inflation eg: Pre GST in Australia.
Sources ofDemand Pull Inflation • Increasing consumption due to changes in consumption patterns (less savings at any level of income).
Sources ofDemand Pull Inflation • Monetary consideration – too much credit in the economy. A relaxed monetary policy leads to a reduction in interest rates leading to an increase in Aggregate Demand and thus prices.
Cost Push Inflation • Cost Push Inflation occurs when prices are pushed up by rising costs to producers who compete with each other for increasingly scarce resources. The increased costs are passed onto consumers.
Cost Push Inflation Price $ Aggregate Supply 2 Aggregate Supply 1 P2 P1 Aggregate Demand Q2 Q1 Real GDP ($)
Cost Push Inflation • An increase in the prices of inputs shifts the aggregate Supply Curve to the left, from AS1 to AS2 pushing up the price level from P1 to P2.
Sources of Cost Push Inflation • Any input may become a major cost to business eg: wage increases lead to higher production costs.
Sources of Cost Push Inflation • Labour shortages in some sectors necessitate wage increases in that sector, however it has a domino effect leading to wage rises in other sectors.
Sources of Cost Push Inflation • NB: Wage rises in excess of productivity increase leads to inflationary pressure. • The extend to which a producer can pass on price rises depends on the level of competition in the industry. • The more competitive the industry, the more the producer has to absorb costs rather than pass them onto consumers.
Sources of Cost Push Inflation • Inflation imported from abroad, eg: the rise in the cost of intermediate goods and resources imported from other countries flows through in the form of higher prices domestically eg: oil prices.
Sources of Cost Push Inflation • Government budgetary problems – an increase in the cost of public utilities eg: electricity, water etc, leads to higher costs to business and households.