Download
1 / 53
530 likes | 756 Vues
Formalizing Relations and Functions. Chapter 1.3. Vocabulary. Relation Domain Range Vertical line test Function notation. Definition. Relation – A relationships that can be represented by a set of ordered pairs. Example:

E N D
Formalizing Relations and Functions Chapter 1.3
Vocabulary • Relation • Domain • Range • Vertical line test • Function notation
Definition • Relation – A relationships that can be represented by a set of ordered pairs. • Example: • In the scoring systems of some track meets, for first place you get 5 points, for second place you get 3 points, for third place you get 2 points, and for fourth place you get 1 point. This scoring system is a relation, so it can be shown by ordered pairs. {(1, 5), (2, 3), (3, 2) (4, 1)}. • You can also show relations in other ways, such as tables, graphs, or mapping diagrams.
Table x y 2 3 4 7 6 8 Example: Relations Express the relation {(2, 3), (4, 7), (6, 8)} as a table, as a graph, and as a mapping diagram. Write all x-values under “x” and all y-values under “y”.
Example: Continued Express the relation {(2, 3), (4, 7), (6, 8)} as a table, as a graph, and as a mapping diagram. Graph Use the x- and y-values to plot the ordered pairs.
2 3 4 7 6 8 Example: Continued Express the relation {(2, 3), (4, 7), (6, 8)} as a table, as a graph, and as a mapping diagram. Mapping Diagram y x Write all x-values under “x” and all y-values under “y”. Draw an arrow from each x-value to its corresponding y-value.
x y Your Turn: Express the relation {(1, 3), (2, 4), (3, 5)} as a table, as a graph, and as a mapping diagram. Table Graph Mapping Diagram y x 1 3 1 3 2 4 2 4 3 5 3 5
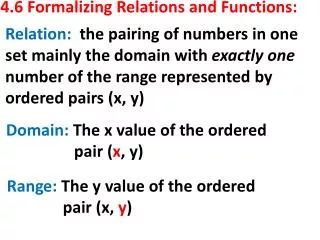
Definition • Domain – The set of first coordinates (or x-values) of the ordered pairs of a relation. • Example: • For the track meet scoring system relation, {(1, 5), (2, 3), (3, 2) (4, 1)}. The domain of the track meet scoring system is {1, 2, 3, 4}. • Range - The set of second coordinates (or y-values) of the ordered pairs of a relation. • For the track meet scoring system relation, {(1, 5), (2, 3), (3, 2) (4, 1)}. The range is {5, 3, 2, 1}.
All y-values appear somewhere on the graph. All x-values appear somewhere on the graph. Example: Finding Domain and Range from a Graph y =5x For y = 5xthe domain is all real numbers and the range is all real numbers.
Only nonnegative y-values appear on the graph. Example: Finding Domain and Range from a Graph y = x2 All x-values appear somewhere on the graph. For y = x2the domain is all real numbers and the range is y ≥ 0.
Your Turn: Give the domain and range of the relation. The domain value is all x-values from 1 through 5, inclusive. The range value is all y-values from 3 through 4, inclusive. Domain: 1 ≤ x ≤ 5 Range: 3 ≤ y ≤ 4
Give the domain and range of the relation. Your Turn: Range Domain Domain: all real numbers Range: y ≥ 0
Your Turn: Give the domain and range of the relation. Range Domain: all real numbers Range: y > -4 Domain
6 –4 5 –1 2 0 1 Your Turn: Give the domain and range of the relation. The domain values are all x-values 1, 2, 5 and 6. The range values are y-values 0, –1 and –4. Domain: {6, 5, 2, 1} Range: {–4, –1, 0}
x y 1 1 4 4 8 1 Your Turn: Give the domain and range of the relation. The domain values are all x-values 1, 4, and 8. The range values are y-values 1 and 4. Domain: {1, 4, 8} Range: {1, 4}
Functions • A function is a special type of relation that pairs each domain value with exactly one range value. • All functions are relations, but all relations are not functions.
Example: Give the domain and range of the relation. Tell whether the relation is a function. Explain. {(3, –2), (5, –1), (4, 0), (3, 1)} Even though 3 is in the domain twice, it is written only once when you are giving the domain. D: {3, 5, 4} R: {–2, –1, 0, 1} The relation is not a function. Each domain value does not have exactly one range value. The domain value 3 is paired with the range values –2 and 1.
Example: Give the domain and range of the relation. Tell whether the relation is a function. Explain. –4 Use the arrows to determine which domain values correspond to each range value. 2 –8 1 4 5 D: {–4, –8, 4, 5} R: {2, 1} This relation is a function. Each domain value is paired with exactly one range value.
Example: Give the domain and range of the relation. Tell whether the relation is a function. Explain. Draw in lines to see the domain and range values Range Domain D: –5 ≤ x ≤ 3 R: –2 ≤ y ≤ 1 The relation is not a function. Nearly all domain values have more than one range value.
Your Turn: Give the domain and range of each relation. Tell whether the relation is a function and explain. a. {(8, 2), (–4, 1), (–6, 2),(1, 9)} b. D: {–6, –4, 1, 8} R: {1, 2, 9} D: {2, 3, 4} R: {–5, –4, –3} The relation is a function. Each domain value is paired with exactly one range value. The relation is not a function. The domain value 2 is paired with both –5 and –4.
Your Turn: Give the domain and range of the relation. Tell whether the relation is a function. Explain. D: {5, 10, 15}; R: {2, 4, 6, 8}; The relation is not a function since 5 is paired with 2 and 4.
Your Turn: Give the domain and range of each relation. Tell whether the relation is a function and explain. D: {-2, -1, 1, 2} R: {3, 4, 5} The relation is a function. Each domain value is paired with exactly one range value.
Vertical line Test • When an equation has two variables, its solutions will be all ordered pairs (x, y) that makes the equation true. Since the solutions are ordered pairs, it is possible to represent them on a graph. When you represent all solutions of an equation on a graph, you are graphing the equation. • Since the solutions of an equation that has two variables are a set of ordered pairs, they are a relation. • One way to tell if this relation is a function is to graph the equation and use the vertical-line test.
x –3x + 2 = y (x, y) (–1, 5) –3(–1) + 2 = 5 –1 0 (0, 2) –3(0) + 2 = 2 1 (1, –1) –3(1) + 2 =–1 Example: Graph each equation. Then tell whether the equation represents a function. –3x + 2 = y Step 2Plot enough points to see a pattern. Step 1 Choose several values of x and generate ordered pairs.
Example: Continued Step 3 The points appear to form a line. Draw a line through all the points to show all the ordered pairs that satisfy the function. Draw arrowheads on both “ends” of the line. Step 4 Use the vertical line test on the graph. No vertical line will intersect the graph more than once. The equation –3x + 2 = y represents a function.
x |x| + 2 = y (x, y) (–1, 3) 1 + 2 = 3 –1 0 (0, 2) 0 + 2 = 2 1 (1, 3) 1 + 2 = 3 Example: Graph each equation. Then tell whether the equation represents a function. y = |x| + 2 Step 2Plot enough points to see a pattern. Step 1 Choose several values of x and generate ordered pairs.
Example: Continued Step 3 The points appear to form a V-shaped graph. Draw two rays from (0, 2) to show all the ordered pairs that satisfy the function. Draw arrowheads on the end of each ray. Step 4 Use the vertical line test on the graph. No vertical line will intersect the graph more than once. The equation y = |x| + 2represents a function.
x 3x –2 = y (x, y) (–1, –5) 3(–1) – 2 = –5 –1 0 (0, –2) 3(0) – 2 = –2 1 (1, 1) 3(1) – 2 = 1 Your Turn: Graph each equation. Then tell whether the equation represents a function. y = 3x – 2 Step 2Plot enough points to see a pattern. Step 1 Choose several values of x and generate ordered pairs.
Your Turn: Continued Step 3 The points appear to form a line. Draw a line through all the points to show all the ordered pairs that satisfy the function. Draw arrowheads on both “ends” of the line. Step 4 Use the vertical line test on the graph. No vertical line will intersect the graph more than once. The equation y = 3x– 2represents a function.
x (x, y) y = |x –1| –1 2= |–1– 1| (–1, 2) 1= |0 – 1| (0, 1) 0 1 0 = |1 – 1| (1, 0) 1= |2 – 1| 2 (2,1) Your Turn: Graph each equation. Then tell whether the equation represents a function. y = |x – 1| Step 2Plot enough points to see a pattern. Step 1 Choose several values of x and generate ordered pairs.
Your Turn: Continued Step 3 The points appear to form a V-shaped graph. Draw two rays from (1, 0) to show all the ordered pairs that satisfy the function. Draw arrowheads on the end of each ray. Step 4 Use the vertical line test on the graph. No vertical line will intersect the graph more than once. The equation y = |x– 1|represents a function.
y 4 3 2 1 x 4 4 3 2 1 1 2 3 2 3 4 Example: Determine whether the discrete relation is a function. y is a function of x.
Your Turn: Determine whether the discrete relation is a function. y is not a function of x.
Determine if the relationship represents a function. 1. The input x = 2 has two outputs, y = 3 and y = 6. The input x = 3 also has more than one output. The relationship is not a function.
Determine if the relationship represents a function. 2. Each input has only one output value. The relationship is a function.
Determine if the relationship represents a function. 3. Pass a vertical line across the graph. Many vertical lines intersect the graph at two points. The relationship is not a function.
y 4 2 x 4 -2 2 -4 -2 -4 Determine if the relationship represents a function. 4. Pass a vertical line across the graph. No vertical lines intersect the graph at more than one point. The relationship is a function.
Determine if the relationship represents a function. 5. Each input x has only one output y. The relationship is a function.
Determine if the relationship represents a function. 6. Each input has only one output value. The relationship is a function.
y x Determine if the relationship represents a function. 7. Pass a vertical line across the graph. No vertical lines intersect the graph at more than one point. 2 -2 2 The relationship is a function. -2
y 4 2 x -4 -2 2 4 -2 -4 Determine if the relationship represents a function. 8. Pass a vertical line across the graph. No vertical lines intersect the graph at more than one point. The relationship is a function.
Function Notation • An algebraic expression that defines a function is a function rule. • If x is the independent variable and y is the dependent variable, then function notation for y is f(x), read “f of x,” where f names the function. • When an equation in two variables describes a function, you can use function notation to write it.
Function Notation The dependent variableisa function ofthe independent variable. yisa function ofx. y=f(x) y = f(x)
Inputs & Outputs The x values, can be thought of as the inputs and the y values or f(x), can be thought of as the outputs. Function Input Output f (x) f x Independent variable Dependent variable
Example: Evaluating Functions Evaluate the function for the given input values. For f(x) = 3x + 2, find f(x) when x = 7 and when x = –4. f(x) = 3(x) + 2 f(x) = 3(x) + 2 Substitute 7 for x. Substitute –4 for x. f(–4) = 3(–4) + 2 f(7) = 3(7) + 2 = –12 + 2 = 21 + 2 Simplify. Simplify. = 23 = –10
Example: Evaluating Functions Evaluate the function for the given input values. For g(t) = 1.5t – 5, find g(t) when t = 6 and when t = –2. g(t) = 1.5t– 5 g(t) = 1.5t– 5 g(6) = 1.5(6) – 5 g(–2) = 1.5(–2) – 5 = –3– 5 = 9– 5 = 4 = –8
For , find h(r) when r = 600 and when r = –12. Example: Evaluating Functions Evaluate the function for the given input values. = 202 = –2
Your Turn: Evaluate the function for the given input values. For h(c) = 2c – 1, find h(c) when c = 1 and when c = –3. h(c) = 2c– 1 h(c) = 2c– 1 h(1) = 2(1) – 1 h(–3) = 2(–3) – 1 = 2– 1 = –6– 1 = 1 = –7