Download
1 / 38
390 likes | 599 Vues
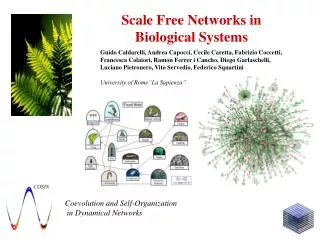
Scale Free Networks in Biological Systems. Guido Caldarelli, Andrea Capocci, Cecile Caretta, Fabrizio Coccetti, Francesca Colaiori, Ramon Ferrer i Cancho, Diego Garlaschelli, Luciano Pietronero, Vito Servedio, Federico Squartini University of Rome“La Sapienza”.

E N D
Scale Free Networks in Biological Systems Guido Caldarelli, Andrea Capocci, Cecile Caretta, Fabrizio Coccetti, Francesca Colaiori, Ramon Ferrer i Cancho, Diego Garlaschelli, Luciano Pietronero, Vito Servedio, Federico Squartini University of Rome“La Sapienza” Coevolution and Self-Organization in Dynamical Networks
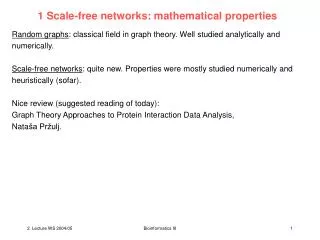
Introduction There is a growing interest in science in the analysis of scale-free networks These ubiquitous structure are characterized by two typical aspects Small World effect That is small diameter Scale-free structure There is not a typical number of links Many sites have few Few have many
Introduction The mathematical characterization of scale-free behaviour is given by POWER-LAWS y=Axg This means that changing the typical scale of x (x’=bx) the kind of relation does not change. • Many power-laws indicate a “physical” long time/space correlation • Critical Phenomena • Laplacian Fractals • Self-Organized Criticality • Others indicate different (trivial?) phenomena • Multiplicative noise (fragmentation, incomes (Pareto’s law), Barabasi model(!?)
Networks and fractals These Complex structures extend the concepts of Self-similarity from Metric Objects (Fractals) to Shape (Networks). Fractal Dimension is defined Fractal Dimension is NOT defined Similarly to Fractals, one finds self-similar properties in “some” distributions. THE MOST NOTICEABLE IS THE NUMBER OF LINK PER SITE We (I mean physicists) are interested in the origin of such scale-free behaviour
Contents • Network Topological properties (degree distribution etc) • Give new description of phenomena allowing • to detect new universal behaviour. • to validate models • Can sometime help in explaining the evolution of the system • As example of this use of graph I will present • Food Webs • Linnean Trees • Protein Interaction Networks • Scale-Free Network arise naturally in RANDOM environments I will present our interpretation of this fact
Basic Graph Theory Is it possible to travel from one part of the city of Königsberg to any other PASSING ALL THE BRIDGES ON THE PREGEL ONLY ONCE ? NO! Euler (1736) pointed out that to be a “passage” point a vertex must have an even number of links. Only starting and ending points can have an odd number of links. THIS IS NOT THE CASE FOR KÖNIGSBERG
Is the problem time dependent? 1736All vertices have odd degree! → No way 2004Only B and C have odd degree! → we can do it!
Graph Topology A Graph G(v,e) is an object composed by v vertices and e edges · Degree k(In-degree kinandout-degree kout) = number of edges (oriented) per vertex · Distance d= minimum number of edges amongst two vertices ( in the connected region !) · Diameter D= Maximum of the distances ( in the connected region !) · Clustering= cliques distribution, or clustering coefficient, communities distribution Usually many quantities are needed In order to “classify” a network
Graph Topology (2) ·1 Degree frequency density P(k)= how many times you find a vertex whose degree is k P(k) k ·2 Degree Correlation Knn (k)=average degree of a neighbour of a vertex with degree k ·3 Clustering Coefficient (k)= the average value of c for a vertex whose degree is k
Disassortative networks Assortative networks Social networks Techological, Biological networks • Real networks always display one of these two tendencies, • “similar” networks display “similar” behaviours. Assortativity coefficient > 0 : Assortative = 0 : Non assortative < 0 : Disassortative
Consequences of assortativity: - Resistence to attacks - Percolation - Epidemic spreading • M.E.J. Newman, Physical Review E, 67 026126 , (2003).
P(A) A • Graph Topology (3) ·4 Centrality betweenness b(k)= The probability that a vertex whose degree is k has betweenness b betweenness of Iis the number of distances between any pair of vertices passing through I ·5 TREES ONLY!!! P(A) = Probability Density for subbranches of size A 1 1 1 1 Size distribution: Allometric relations: 1 1 3 5 1 1 C(A) 11 5 2 3 1 1 22 8 A 10 33
Models (1) Standard Theory of Random Graph(Erdös and Rényi 1960) Small World(D.J. Watts and S.H. Strogatz 1998) P(k) k Degrees are Poisson distributed Random Graphs are composed by starting with n vertices. With probability p two vertices are connected by an edge Small World Graph are composed by adding shortcuts to regular lattices Degrees are peaked around mean value
Models (2) Model of Growing Networks(A.-L. Barabási 1999) 1) Growth Every time step new nodes enter the system 2) Preferential Attachment The probability to be connected depends on the degree P(k) k Degrees are Power law distributed Intrinsic Fitness Model (G.Caldarelli A. Capocci, P.De Los Rios, M.A. Munoz 2002) 1) Growth or not Nodes can be fixed at the beginning or be added 2) Attachment is related to intrinsic properties The probability to be connected depends on the sites Degrees are Power law distributed
Intrinsic Fitness Model Without introducing growth or preferential attachment we can have power-laws We consider “disorder” in the Random Graph model (i.e. vertices differ one from the other). This mechanism is responsible of self-similarity in Laplacian Fractals • Dielectric Breakdown • In reality • In a perfect dielectric
Intrinsic Fitness Model Different realizations of the model a) b) c) have r(x) power law with exponent 2.5 ,3 ,4 respectively. d) has r(x)=exp(-x) and a threshold rule.
Intrinsic Fitness Model Degree distribution for cases a) b) c) with r(x) power law with exponent 2.5 ,3 ,4 respectively. Degree distribution for the case d) with r(x)=exp(-x) and a threshold rule.
“Food Web”(ecological network): Set of interconnected food chains resulting in a much more complex topology:
Degree Distribution P(k) in real Food Webs Unaggregated versions of real webs: irregular or scale-free? P(k)k- R.V. Solé, J.M. Montoya Proc. Royal Society SeriesB268 2039 (2001) J.M. Montoya, R.V. Solé, Journal of Theor. Biology 214 405 (2002)
In general, the same graph can have more spanning trees with different topologies. Since the peculiarity of the system (FOOD WEBS),some are more sensible than the others. • Spanning Trees of a Directed Graph A spanning tree of a connected directed graph is any of its connected directed subtrees with the same number of vertices.
Out-component size: Sum of the sizes: Allometric relations: Out-component size distribution P(A) : C(A) P(A) A A • How to characterize a tree? 1 1 1 1 1 3 1 1 5 1 5 2 11 3 8 1 22 1 10 33
Allometric Relations in Real Food Webs (D.Garlaschelli, G. Caldarelli, L. Pietronero Nature 423 165 (2003))
efficient inefficient unstable stable
Lazio Utah Iran Amazonia Peruvian and Atacama Desert Argentina we focus our attention on plants in order to obtain a good universality of the results we have chosen a great variety of climatic environments • Ecosystems around the world Ecosystem= Set of all living organisms and environmental properties of a restricted geographic area
phylum subphylum class subclass order family genus species Connected graph without loops or double-linked nodes • From Linnean trees to graph theory Linnean Tree= hierarchical structure organized on different levels, called taxonomic levels, representing: • classification and identification of different plants • history of the evolution of different species A Linnean tree already has the topological structure of a tree graph • each node in the graph represents a different taxa • (specie, genus, family, and so on). All nodes are • organized on levels representing the taxonomic one • all link are up-down directed and each one • represents the belonging of a taxon to the relative • upper level taxon
~ 2.5 0.2 • Scale-free properties Degree distribution: P(k) k The best results for the exponent value are given by ecosystems with greater number of species. For smaller networks its value can increase reaching = 2.8 - 2.9.
Tiber Mte Testaccio Aniene Lazio City of Rome Colli Prenestini P(k) k =2.52 0.08 =2.58 0.08 • Geographical flora subsets P(k) P(k) k k 2.6 ≤ ≤ 2.8
In spite of some slight difference in the exponent value, a subset which represents on its own a geographical unit of living organisms still show a power-law in the connectivity distribution. random extraction of 100, 200 and 400 species between those belonging to the big ecosystems and reconstruction of the phylogenetic tree P(k) P(k) P(k) LAZIO ROME k k k • Simulation: P(k) P(k) P(k)=k -2.6 k k • What about random subsets?
P(k) P(k) k k A comparison Not Correlated: Correlated:
Protein Interaction Network of Yeast • (Saccaromyces Cerevisiae)
Protein Interaction Network of Fruitfly • (Drosophila Melanogaster)
← Scale-Free Degree distribution Scale-Free Betweenness b(k) →
← neighbors degree per degree Knn(k) Clustering per degree c(k) →
Conclusions Results: • networks (SCALE-FREE OR NOT) allow to detect universality (same statistical properties) for FOOD WEBS and TAXONOMY. Regardless the different number of species or environments. • STATIC AND DYNAMICAL NETWORK PROPERTIES other than the degree distribution allow to validate models. NEITHER RANDOM GRAPH NOR BARABASI-ALBERT WORK IT IS POSSIBLE THAT PROPERTIES OBSERVED ARE REALLYRANDOM BECAUSE RANDOM GRAPH CAN GIVE POWER LAWS! Future: • new data • suitable models taking into account also environment and natural selection
COSINCOevolution and Self-organisation In dynamical Networks RTD Shared Cost Contract IST-2001-33555 http://www.cosin.org • Nodes 6 in 5 countries • Period of Activity: April 2002-April 2005 • Budget: 1.256 M€ • Persons financed: 8-10 researchers • Human resources: 371.5 Persons/months EU countries Non EU countries EU COSIN participant Non EU COSIN participant