Download
1 / 1
10 likes | 27 Vues
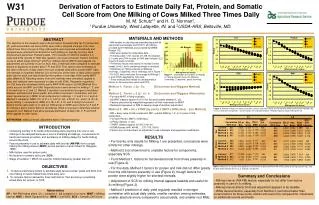
W31. Derivation of Factors to Estimate Daily Fat, Protein, and Somatic Cell Score from One Milking of Cows Milked Three Times Daily M. M. Schutz* 1 and H. D. Norman 2 , 1 Purdue University , West Lafayette, IN , and 2 USDA-ARS , Beltsville, MD . MATERIALS AND METHODS. Fat. Protein.

E N D
W31 Derivation of Factors to Estimate Daily Fat, Protein, and Somatic Cell Score from One Milking of Cows Milked Three Times Daily M. M. Schutz*1 and H. D. Norman2, 1Purdue University, West Lafayette, IN, and 2USDA-ARS, Beltsville, MD. MATERIALS AND METHODS Fat Protein ABSTRACT The objective of this research was to derive factors to predict daily fat (F) and protein (P) yield and somatic cell score (SCS) when milk is sampled once per d for cows milked three times (3x) per d. Daily milk weights were recorded automatically and samples were collected from 8 herds for each milking on test-day by Dairy Herd Improvement personnel. Following edits, 1721 records of 1236 first lactation (L1) cows and 2704 records of 1940 later lactation (L2) cows remained. Factors currently in use to adjust single milking F and P for milking interval (MINT) were applied. No adjustments are currently in use for SCS. Also, 2 methods were compared to estimate factors or equations to predict daily F, P, and SCS. First, factors were estimated as the ratio of the sum of daily yield to the sum of partial yield within a parity-MINT class (13 intervals in 2 parities) [Method 1] or as the sum of the ratios of daily yield to partial daily yield for each cow-day divided by the number of cow-days within parity-MINT class [Method 2]. Resulting factors from both methods were smoothed, applied to data, and residuals were regressed on days in milk (DIM). Regression equations (n=112) were also developed within parity-MINT-DIM classes (2x7x8) [Method 3] to jointly account for MINT and DIM. Separate factors were derived for milking 1, 2, and 3 for each trait in L1 and L2. Method 3 resulted in consistently strongest correlations between estimated and actual yields, and smallest variances of estimates, and root mean squared errors (rMSE) for all components in milkings 1, 2, and 3 in L1 and L2. Method 3 resulted in rMSE of 0.14 (F, L1), 0.22 (F, L2), 0.09 (P, L1), and 0.14 (P, L2) kg for milking 1; compared to rMSE of 0.18, 0.27, 0.12, and 0.16 kg from current factors for the same traits in L1 and L2. Differences in rMSE were similar for F and P for milking 2 and 3 and for SCS for all milkings. Work is ongoing to determine whether equations from Method 3 will allow accurate estimation of daily milk, F, P, and SCS when applied to other herds. KEYWORDS: milking interval, adjustment factor, milking frequency • Milk weights on test day and preceding days and fat and protein percentages and SCS for all milkings provided by DHI Affiliates and compiled by DRMS, Raleigh, NC. • Edits were applied for reasonable data. • Following edits, 1721 records of 1236 first lactation (L1) cows and 2704 records of 1940 later lactation (L2) cows in 8 herds remained. • Preliminary results and paucity of records of other breeds (n=45), led to combining breeds for analysis. • Distribution of milking intervals for Milkings 1 (morning), 2 (daytime), and 3 (evening) are in Figure 1. • For SCS, daily value was the average of Milkings 1, 2, and 3 SCS weighted by milk yield. • Three methods were tested for development of factors for fat and protein yields and SCS. All Breeds Factor Factor Observations Milking Interval (hours) Milking Interval (hours) Milking Interval (Hours) SCS Milk Figure 1. Distribution of numbers of records in milking interval classes for Milkings 1(morning), 2 (daytime), and 3 (evening). Method 1: Factor = Σy / Σx [DeLorenzo and Wiggans Method] & Method 2: Factor = Σ (y / x) / n [DeLorenzo and Wiggans Alternative] Factor Factor • For each MINT x Parity subclass. • 26 MINT classes (approx 6-9.5 h for 3x) and 2 parity classes (1, ≥2). • Factors smoothed by weighted regression of their reciprocals on MINT. • Residuals regressed on DIM to develop stage of lactation adjustment. Milking Interval (hours) Milking Interval (hours) Method 3: MD = b0 + b1MP (by parity x MINT x DIM class) [Liu Method] Figure 2. Method 1 factors to adjust fat, protein, somatic cell score (SCS), or milk yield for milking interval from Milking 1 for first (L1) and later (L2) parities. Current factors are indicated in black. Red dot indicates equal milking interval. • MD = daily value of milk component, MP = partial (Milking 1, 2, or 3) value of milk component. • For each Parity x MINT x DIM class. • 2 Parity classes (1, ≥2). • 7 MINT classes (approx 6.5-9.5 h for 3x). • 8 DIM classes (≤45, 46-90, … 271-315, ≥316). • Factors are not smoothed, so adjustment uses intercepts and regression coefficients. L1 L2 Abs. Diff. Current NA 0.023 0.071 0.077 NA 0.021 0.054 0.047 NA 0.226 0.513 Abs. Diff. Current NA 0.035 0.114 0.118 NA 0.023 0.065 0.062 NA 0.225 0.528 Root MSE 0.177 0.179 0.193 0.139 0.117 0.116 0.127 0.092 1.172 1.014 0.737 Correlation With true .835 .834 .834 .860 .886 .889 .889 .913 .877 .884 .912 Current Method 1 Method 2 Method 3 Current Method 1 Method 2 Method 3 Current Method 1 Method 3 SD of Est. 0.320 0.324 0.337 0.235 0.250 0.252 0.263 0.205 2.340 2.150 1.637 Abs. Error 0.121 0.124 0.137 0.105 0.073 0.074 0.086 0.067 0.544 0.553 0.511 Root MSE 0.269 0.273 0.300 0.220 0.162 0.162 0.174 0.140 1.234 1.125 0.893 Correlation With true .846 .846 .842 .868 .901 .900 .899 .911 .883 .891 .908 Abs. Error 0.060 0.006 0.066 0.055 0.035 0.035 0.036 0.034 0.432 0.436 0.455 SD of Est. 0.501 0.511 0.535 0.385 0.371 0.370 0.383 0.310 2.583 2.469 1.933 • INTRODUCTION • Increasing number of 3x herds utilize testing plans requiring only one or two milkings to be sampled because of cost of sampling all milkings, convenience for herds and service providers, and avoidance of milking delays for herds milking around the clock. • Factors presently in use to estimate daily milk and fat (AM-PM) from a single milking for milking interval (MINT) across parities in herds milked 3x (Wiggans, 1986). • Milk factors used for protein yield. • No factors for somatic cell score (SCS). • Stage of lactation × MINT not used for milking frequency greater than 2x. • OBJECTIVES • 1. To derive preliminary factors to estimate daily fat and protein yields and SCS from one milking in herds milked three times daily, and • 2. To compare factors derived by three methods for their accuracy in predicting actual daily fat, protein, or SCS. Fat RESULTS • For brevity, only results for Milking 1 are presented, conclusions were similar for other milkings. • Method 2 (not shown) led to unstable factors for components, especially SCS. • From Method 1, factors for fat deviated most from those presently in use (Figure 2). • For this data, Method 1 factors for protein and milk did not differ greatly from the milk factors presently in use (Figure 2), though factors for protein were slightly higher for shortest intervals. • Adjustment of SCS for milking interval appears feasible and useful for 3x milking (Figure 2). • Method 3 prediction of daily yield regularly resulted in stronger correlation with actual daily yields, smaller variation among estimates, smaller absolute errors compared to actual yields, and smaller root MSE. Protein SCS Table 1. Measures of variation and goodness of estimation of daily yield from AM milking yields of fat (kg), protein (kg), and SCS by three methods for first (L1) and later (L2) parities. • Summary and Conclusions • Milking interval (AM-PM) factors, especially for fat, differ from factors presently in use for 3x milking. • Milking interval affects SCS and adjustment appears to be feasible. • While derived factors, especially from Method 3, performed better than current factors for these herds, factors will need to be compared for robustness on additional records and herds. Abbreviations AP =AM-PM testing plans, L1 = Lactation 1, L2 Lactation 2 or more, MINT = Milking interval, MSE = Mean Squared Error, rMSE = root MSE, SCS = Somatic Cell Score