Download
1 / 16
160 likes | 393 Vues
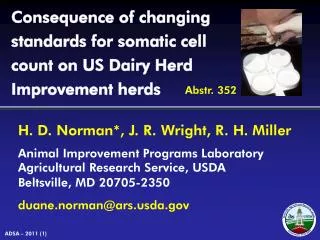
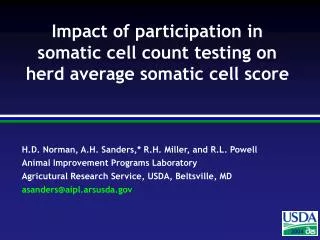
Impact of participation in somatic cell count testing on herd average somatic cell score. National Mastitis Screening. 93% of cows on DHI test plans participate in mastitis screening. 3.8 million cows. 25,000 herds. 20% less herds than in 2000, although number of cows unchanged.

E N D
Impact of participation in somatic cell count testing on herd average somatic cell score
National Mastitis Screening • 93% of cows on DHI test plans participate in mastitis screening. • 3.8 million cows. • 25,000 herds. • 20% less herds than in 2000, although number of cows unchanged. • Herd average somatic cell count (SCC) has increased since 1995, but was slightly lower in the last 2 years.
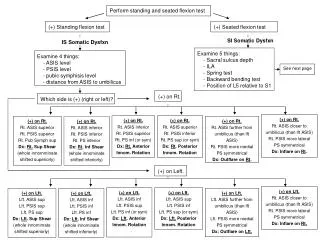
Objectives • Evaluate the effectiveness of mastitis screening in reducing herd average somatic cell score (SCS). • Investigate seasonal and regional differences in herd average SCS.
Data • Base herds selected • Started SCC testing after July 1995 • Milked 2x for the first 30 months of testing • Herd Test day records screened • Dropped after >6 mo of no test • Included 10 cows with SCC records and 50% of cows in milk • Herds screened • >1 month of testing • 1st month on test met test day record screening
Data • 51,589 test days in 2950 herds • Included on herd test day records • Test date • Time herd on testing (mo) • Region • Calculated from cow test day records • Mean milk/cow • Mean SCS/cow (weighted by milk)
Regions Northwest Northeast Midwest 68 1492 1089 Southwest 79 222 Southeast
Initiation of SCC Testing by Region 800 Northeast 700 Midwest Southeast 600 Northwest 500 Southwest Herds 400 300 200 100 0 1995 1996 1997 1998 1999 2000 2001 2002 2003 2004 July - -June Year of First SCC Test
Methods Model: SCSHerd TD = Herd + Season + Test month + Time on test Where: Season = calendar month Test month = months since June 1995 Time on test = months since herd’s first SCC test
Northeast Midwest Southeast Regional Herd SCS
Mastitis Based Culling Decisions 2100 Herds with cows coded “culled for mastitis”
Mastitis Based Culling Decisions Northeast (841) Midwest (1011) Southeast (151) Northwest (39) Southwest (58)
Northeast Midwest Southeast Northwest Southwest Seasonal Effects by Region 0.30 0.25 0.20 0.15 0.10 Herd SCS Effect 0.05 0 -0.05 -0.10 -0.15 Jan Feb Mar Apr May Jun Jul Aug Sep Oct Nov Dec Month
Summary • Participation in mastitis screening may be helpful in reducing bulk tank SCC. • SCS is seasonally affected. • Culling for mastitis increased slightly during the first months on SCC testing.
Related Areas of Interest • Effect of changes in milking frequency on herd SCS • Effect of herd size and changes in herd size on herd SCS • Impact of individual cows (culling) vs. herd-wide effects on herd SCS