Microarray vs. RNA-Seq: A Comparative Study in Gene Expression Profiling
Understand the differences between microarray and RNA-seq technologies for gene expression profiling, including experimental design, data analysis methods, and common pitfalls to avoid. Explore the advantages and limitations of each approach in studying gene expression patterns.


Microarray vs. RNA-Seq: A Comparative Study in Gene Expression Profiling
E N D
Presentation Transcript
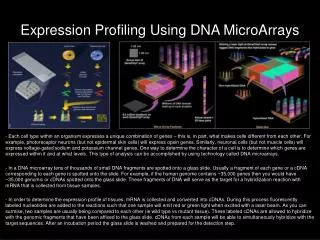
Question: What’s a microarray? Answer: A microarray is a high density array of “molecules” attached to a solid support. 1) What does high-density mean? -millimeters, microns, sub-micron? -Affymetrix Patent, 1000 probes/cm2 2) What kind of molecules? -nucleic acids, proteins, organics, cells, tissues 3) How are they attached? -specifically, non-specifically, covalently, non-covalently 4) What kind of support? -glass, nylon, other polymers
Array Options • 1 - 70mers Up to 390,000 features per array
Experimental Design 1 • Key Point: We know beforehand what sequence is in each position on the array • Synergy with genome sequencing projects • What kind of experiments can I do on a DNA chip? • Any assay whose readout is the enrichment of nucleic acid sequences • What is measured? • The fluorescent intensity, or ratio of intensities, at a particular location on the array
Experimental Design 2 mRNA1 mRNA1 mRNA2 cDNA1 cDNA2 cDNA1
Scaling Signal Intensities -total fluorescence is scaled to be equal in both experiments -every spot on the array is multiplied by the same scaling factor Where N=number of genes on array I=intensity on the array T=some set arbitrary number Assuming total RNA is constant between experiments
Fold-Changes Why use the log? Answer: provides symmetry around zero 10 copies mRNA/20 copies mRNA = 0.5 20 copies mRNA/10 copies mRNA = 2.0 But, log2(10 copies mRNA/20 copies mRNA ) = -1 log2(20 copies mRNA/10 copies mRNA ) = 1
RNA.seq • Rapidly replacing array based methods mRNA cDNA sequence count
Counting can be non-trivial • 3’ poly T priming bias • 5’ and 3’ UTR boundaries • Alternate splicing • Cryptic exons • Cryptic start sites • Paired-end reads can help
RPKM • Reads Per Kilobase per Million reads Assuming total RNA is constant between experiments
RNA.seq continued • No genome sequence necessary (de novo transcriptome assembly) • Dynamic range and sensitivity limited only by sequencing capacity • Specificity an issue with short reads • Splice sites • 5’ and 3’ UTR mapping • Multiplexing!
Multiplexing with sample barcodes Sample 2 Sample 1 mRNA cDNA ligatebarcoded sequencing primers pool samples and sequence
Finding significant fold changes Sample 2 Sample 1 C1 C2 X1 X2 Is X1/C1 less than X2/C2? C1= total number of mapped reads in sample 1 X1 = number of reads in sample 1 that map to gene X C2 = total number of mapped reads in sample 2 X2 = number of reads in sample 2 that map to gene X
Significance testing with Hypergeometric (Fishers Exact Test) Pooled Sample Sample 1 C1+C2 C1 X1 X1+X2 Ho: X1/C1 = X1+X2/C1+C2 Ha: X1/C1 < X1+X2/C1+C2
Significance testing with Hypergeometric (Fishers Exact Test) Remember that:
…but with replication we just revert to t-tests (more or less) Sample 1 Sample 2 C1A C2A Replicate A X1A X2A C1B C2B X1B Replicate B X2B C1C C2C X1C Replicate C X2C
…but with replication we just revert to t-tests (more or less) Is (X1A/C1A, X1B/C1B, X1C/C1C) different from (X2A/C2A, X2B/C2B, X2C/C2C) ?
Gaussian (Normal) Distributions I • Mean (x) = • Standard Deviation (s) = # of people height
What is a significant change? • Arbitrary • 2-fold • Top 20 • Two sample t-test • P-values, multiple hypotheses, and the Bonferroni correction • SAM, Tusher et al. (2001) PNAS 98,5116-5121 • ANOVA
Microarray vs. RNA.seq • Cost, Time, Throughput • Serial vs. Parallel • Sensitivity • Specificity • Signal to Noise • Dynamic Range
Gene Clustering • Metrics for determining coexpression • Unsupervised Clustering • Supervised Clustering
Gene 1 Gene Clustering
v1 v2 Condition 2 v5 v4 v3 Condition 1 Clustering Gene Expression Data • Choose a distance metric • Pearson Correlation • Spearman Correlation • Euclidean Distance • Mutual Information • Choose clustering algorithm • Hierarchical • Agglomerative • Principle Component Analysis • Super-paramagnetic and others
Pearson Correlation Coefficient • Compares scaled profiles! • Can detect inverse relationships • Most commonly used • Spearman rank correlation technically more correct n=number of conditions x=average expression of gene x in all n conditions y=average expression of gene y in all n conditions sx=standard deviation of x Sy=standard deviation of y
Correlation Examples Raw Data Normalized Correlation = 0.94 Correlation = -0.087
Correlation Pitfalls 1 Correlation=0.97
Correlation Pitfalls 2 Correlation=-0.02
Avoid Pitfalls By Filtering The Data • Remove Genes that do not reach some threshold level in at least one (or more) conditions • Remove genes whose stdev/mean ratio does not reach some threshold • For spotted arrays, remove genes whose stdev does not reach some threshold
c b a a2 + b2 = c2 Euclidean Distance • Based on Pythagoras • Scaled versus unscaled • Cannot detect inverse relation ships For Gene X=(x1, x2,…xn) and Gene Y=(y1, y2,…yn)
A D Clustering: Example 1, Step 1 Algorithm: Hierarchical, Distance Metric: Correlation
A B D C Clustering: Example 1, Step 2 Algorithm: Hierarchical, Distance Metric: Correlation
A B D C E Clustering: Example 1, Step 3 Algorithm: Hierarchical, Distance Metric: Correlation
Tree ViewEisen et al. (1998) PNAS 95: 14863-14868 conditions genes
Advantages Easy Very Visual Flexible (mean, median, etc.) Disadvantages Unrelated Genes Are Eventually Joined Hard To Define Clusters Manual Interpretation Often Required A B D C E Hierarchical Clustering Summary
k1 k2 k3 Clustering: Example 2, Step 1 Algorithm: k-means, Distance Metric: Euclidean Distance
k1 k2 k3 Clustering: Example 2, Step 2 Algorithm: k-means, Distance Metric: Euclidean Distance
k1 k2 k3 Clustering: Example 2, Step 3 Algorithm: k-means, Distance Metric: Euclidean Distance
k1 k2 k3 Clustering: Example 2, Step 4 Algorithm: k-means, Distance Metric: Euclidean Distance
k1 k2 k3 Clustering: Example 2, Step 5 Algorithm: k-means, Distance Metric: Euclidean Distance
K-means algorithm • Pick a number (k) of cluster centers • Assign every gene to its nearest cluster center • Move each cluster center to the mean of its assigned genes • Repeat 2-3 until convergence
Advantages Genes automatically assigned to clusters Can vary starting locations of cluster centers to determine initial condition dependence Disadvantages Must pick number of clusters before hand All genes forced into a cluster K-means clustering summary
Keep in Mind. • Clustering is NOT an analysis in itself. • Clustering cannot NOT work.
Evaluating/Analyzing Clusters 1 • Measure spread within and between clusters
Evaluating/Analyzing Clusters 2Enrichment of genes with similar functions • MIPS (Munich Information Center For Protein Sequences) http://mips.gsf.de/ • GO (Gene Ontology) Annotations http://www.geneontology.org/ • KEGGS (Kyoto Encyclopedia of Genes and Genomes) http://www.genome.ad.jp/kegg/kegg2.html
Example A particular cluster has 25 coexpressed genes in it. 15 of these genes are annotated as being involved in rRNA transcription. Is 15/25 significant?
Hypergeometric Probability Distributionthe “overlap problem” or sampling without replacement N • N = number of genes in the genome (6000 for yeast) • n = number of genes in the cluster (25) • m = number of rRNA transcription genes (109 from MIPS) • s = number of rRNA transcription genes in the cluster (15) m n s
Hypergeometric Probability Distribution 6000 109 25 15
Therefore in our example… 6000 109 25 15 • 15/25 rRNA transcription genes in the cluster is significant. • BUT… • 10 out of 25 genes in the cluster are not rRNA transcription genes. • 94 rRNA transcription genes are not in the cluster. • What about the other genes in the cluster?