Predictive Value of Multi-Gene Expression in Primary Prostate Cancer
10 likes | 142 Vues
This study investigated whether specific transcript markers related to prostate cancer (PCa) can serve as reliable predictors for the disease. Through quantitative measurements of mRNA levels from matched tissue samples, we assessed the potential of nine PCa-related markers in predicting localized disease against a backdrop of four housekeeping genes. Our findings highlight significant correlations in expression levels, enhancing the understanding of mRNA's role in PCa diagnosis and prognosis, potentially aiding clinical decision-making for better patient outcomes.

Predictive Value of Multi-Gene Expression in Primary Prostate Cancer
E N D
Presentation Transcript
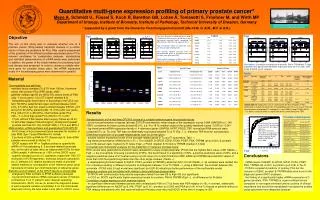
Quantitative multi-gene expression profiling of primary prostate cancer* Meye A, Schmidt U1, Füssel S, Koch R, Baretton GB, Lohse A, Tomasetti S, Froehner M, and Wirth MP Department of Urology, Institute of Biometry, Institute of Pathology, Technical University of Dresden, Germany * supported by a grant from the Deutsche Forschungsgemeinschaft (Me-1649, to A.M., M.F. & G.B.). axel.meye@uniklinikum-dresden.deorwww.tu-dresden.de\meduro\ Tab2a Fig4 Fig1 Objective The aim of this study was to evaluate whether one of 9 prostate cancer (PCa)-related transcript markers or a combi-nation of them are predictors for PCa. After careful assessment of the potential of the different prostate-associated and/or PCa-relevant candidates for comparative analyses, standardized and validated measurements of mRNA levels were performed. In addition, the power of the single markers for predicting local-ized disease was assessed. In order to choose a suitable refer-ence gene for prostate tissue pairs, the mRNA expression levels of 4 housekeeping genes were determined in parallel. Fig1 (left):Boxplots of mRNA expression levels of different reference genes (distribution of log-transformed transcript levels, normalized to RNA amounts; differences of unpaired t‑tests) Fig2 (left below):Ratios of expression levels (Tu:Tf) of prostate-related genes Tab1 (below):Relative transcript levels of prostate-related genes in prostate tissues and cell lines (zmol gene/zmol TBP) Tab2a(right): Calculation of AUC values for the expression levels by ROC analyses . Fig4 (above):Correlation of expression of prostein, PSA & TRPM8 with T stage [unpaired t-test, log-transformed relative expression levels for Tf (n=106), OCD (n=59) & NOCD (n=47) samples] Fig2 Tab1 Tab2b • Material • Tumor patients and cell lines • - matched tissue samples (Tu & Tf) from 106 pts. (hormone-naïve) with primary PCa (RPE cases, cM0) • patients’ median age 64 yrs (48 to 78), serum levels of PSA (day -1 pre-surgery) 1.3 to 57.2 ng/ml (median 8.3) • histopathological examination of according to the UICC sys-tem: 59 (56%) patients had organ-confined disease (OCD, pT2), 47 (44%) had non organ-confined disease (NOCD, pT3 and pT4); 92 (87%) patients pN0, 14 (13%) pN1; low grade PCa (GS 2 to 6; n=28 (26%), intermediate grade PCa (GS = 7; n=5) & high grade PCa (GS 8 to 10; n=27); • 77 pts. without PSA relapse after surgery (follow-up 32 m), 10 with PSA relapse (PSA ≥0.2ng/ml), 29 adjuvant treatedt • prostate cell lines DU 145, LNCaP, 22Rv1, PC-3 and BPH-1 • RNA isolation, cDNA synthesis and quantitative PCR (QPCR) • 50-60 slices of kryo-preserved tissue samples for isolation of total RNA (Spin Tissue RNA Mini Kit; Invitek) • 2 portions of 500 ng RNA for RT (Superscript II), both cDNA samples were pooled & diluted 1:5 • QPCR assays with HP or TaqMan probes to quantify the mRNA of 4 housekeeping & 9 prostate-related transcripts (list, at the right) at least twice as independent PCRs for each cDNA sample, if differences of >30% a third QPCR round • quantity standard curves (LC capillaries coated with 10E1-E7 molecules of PCR fragments); transcript amounts calculation by LC-software 3.5; relative expression levels of prostate-related markers by normalization to the reference gene (zmol transcripts of marker per zmol transcripts of reference gene) • Statistics and correlation of the QPCR results to clinical data • analyses by SAS software & SPSS software packages • log-transformed relative mRNA expression levels of markers (comparison Tu & Tf, paired t‑test); receiver-operating characteristic (ROC) curves (to assess the diagnostic power of each separate variable univariately) & for the multivariate diagnostic rule by the area under curve (AUC) of ROC curve Tab2b(above): Diagnostic rule of a logit model for the prediction of PCa [calculation example for patient #1: the probability p for Tu tissue results from the transformation p=exp(logit)/[1+exp(logit)] = exp(2.298)/[1+exp(2.298)]=90.9% * Cut points used are given as expression levels (zmol gene/zmol TBP). • Results • Standardization of the real-time QPCR & choice of a suitable reference gene for prostate tissues • - run-to-run performance of assays (at least 23 PCR runs/marker): mean slopes of the regression curves 0.984 (GAPDH) to 1.149 (TBP); correlation for these curves at least 99.9 %, s.d. 4 to 18 %; median slope of the quantity standard curves –3.575 to –3.341 • - log-transformed mRNA expression levels of 4 reference genes (GAPDH, HPRT, PBGD, TBP, normalized RNA amount) were compared (Tu vs. Tf); only TBP was not differntially expressed between Tu & Tf (Fig. 1 ), therefore TBP level for normalization. • Differential expression of prostate-related genes (see list at the right) • median relative expression levels of the prostate-related genes in Tu and Tf specimens: Tab1 • log-transformed relative mRNA levels in Tu > Tf for AibZIP, D-GPCR, EZH2, PCA3, PDEF, PSA, TRPM8 (all p<0.001) & prostein (p=0.018; paired t‑test); highest Tu:Tf ratios (Fig2 ) PCA3 (median 37.5-fold) & TRPM8 (median 3.7-fold) • Univariate and multivariate analyses for the prediction of malignant prostate tissue • ROC curves were generated & and AUC were calculated for every single parameter (PCA3 has the highest AUC value =0.85 (Tab2a , Fig3 ). As an example, choosing a sensitivity of 95%, this would result in a specificity of 46%, a positive predictive value of 64%, and a negative predictive value of 91% when using a cut off value of 0.4 zmol PCA3/zmol TBP. EZH2 and TRPM8 also had AUC values of more than 0.80 thus performing better than the other single markers (Tab2a ). • - a developed logit model (based on EZH2, PCA3, prostein & TRPM8) yielded an AUC of 0.90 (Tab2b ); all variables were divided into 2 to 4 classes resulting in different cut points to distinguish between Tu & Tf (Tab2b ); using a Wald test, the contrast between the univariate (PCA3 only) & logit model was significant (p=0.0015) indicating a better performance of the multivariate model • Subgroup analysis and correlation with relevant clinico-pathological parameters • D‑GPCR with continuously rising relative expression levels from low GS to high GS (not significant) • in OCD vs. NOCD significantly higher expression levels for prostein, PSA & TRPM8 (Fig4 ), no differences for N status • Correlation of gene expression with treatment failure • - no significant differences between patients with undetectable PSA (n=77) & those with PSA relapse (n=10); in contrast, statistically significant differences for AibZIP (p=0.049), PDEF (p=0.01), prostein (p=0.006) and PSA (p=0.04) in the Tu tissues of patients without a PSA relapse and patients who had received adjuvant therapy since they had NOCD at the time of surgery(n=29) Prostate-related genes Comparison of the univariate model for PCA3 with the logit model based on the 4-gene signature ROC curves for PCA3 (AUC=0.85) in comparison to the multivariate logit model comprising EZH2, PCA3, prostein and TRPM8 (AUC=0.90). Fig3 • Conclusions • mRNA levels of AibZIP, D-GPCR, EZH2, PCA3, PDEF, PSA, TRPM8 (all <0.001) & prostein (p=0.019) in Tu>Tf • PCA3 is a powerful predictor of primary PCa but the inclusion of EZH2, prostein & TRPM8 adds even more to the diagnostic power (ROC analyses) • the finding of a significantly higher mRNA expression of 3 genes (prostein, PSA, TRPM8) in organ-confined tumors compared to non-organ-confined tumors could be of clinical importance and should be reevaluated in prospective studies using specimens from diagnostic biopsies