111
111. A comparison of age-depth scales derived from shallow ice cores and an FMCW radar in West Antarctica Lora Koenig 1* , Vincent Onana 1,2 , Rick Forster 3 , Clement Miège 3 , Summer Rupper 4 , Landon Burgener 4 , Aqsa Patel 5 and Joseph MacGregor 6

111
E N D
Presentation Transcript
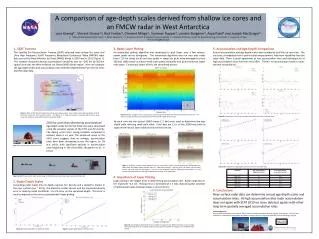
111 A comparison of age-depth scales derived from shallow ice cores and an FMCW radar in West Antarctica Lora Koenig1*, Vincent Onana1,2, Rick Forster3, Clement Miège3, Summer Rupper4, Landon Burgener4, Aqsa Patel5 and Joseph MacGregor6 NASA Goddard Space Flight Center 2. Adnet Systems Inc. 3. University of Utah 4. Brigham Young University 5. University of Kansas, Center for Remote Sensing of Ice Sheets 6. University of Texas *lora.s.koenig@nasa.gov 1. SEAT Traverse The Satellite Era Accumulation Traverse (SEAT) collected near-surface firn cores and Ultra High Frequency (UHF) Frequency Modulated Continuous Wave (FMCW) radar data across the West Antarctic Ice Sheet (WAIS) divide in 2010 and in 2011 (Figure 1). This traverse measured annual accumulation variability over an ~200 km by 300 km spatial area over the West Antarctic Ice Sheet (WAIS) divide region. Here we compare the age-depth scales and accumulation rates derived independently from the ice cores and the radar data. 3. Radar Layer Picking An automated picking algorithm was developed to pick linear, over a few meters, power peaks across echograms. The automated algorithm was run over ever radar trace (~20 cm along track) and then peaks in range bin picks were averaged to every 100 and 1000 traces to reduce small scale spatial variability and pick continuous layers over space. Continuous layers of km’s are considered annual. 5. Accumulation and Age-Depth Comparison Annual accumulation and age-depth scales were compared at all the ice core sites. The ice cores, as expected from a point-source measurement, had more variability than the radar data. There is good agreement at low accumulation sites and discrepancies at high accumulation sites from the mid 1990’s. There is no accumulation trend in radar-derived accumulation. Figure 1: Map of SEAT Traverse (red lines) and ice cores (yellow stars). Near-surface radar data was gather in 2010 (northern route) and 2011 (southern route). The Morse et al. 2002 accumulation map (red high and blue low) shows the long-term accumulation pattern across the divide. Figure 6: Radar echogram from a grid pattern (inset) surrounding SEAT 10-4 with automated layer picks (x). The picks are assumed annual occurring in January with December 2010 at the surface. Figure 9: Comparison of annual accumulation derived from ice core and radar data. At each core site the closest 10000 traces (~2 km) were used to determine the age-depth scale reducing small-scale noise. Error bars are ±1 σ of the 1000 trace picks to capture the natural layer variation around the core site. 2010 Ice cores show decreasing accumulation! Age-depth scales for the five 2010 core were developed using the seasonal signals of the δ18O and δD records. The dating errors from coring methods compared to volcanic dates is ±1 year. The combined mean of the 2010 cores suggests that on average, accumulation rates have been decreasing across the region, by .38 w.e. cm/yr, with significant declines in accumulation rates beginning in the mid-1990s. (Burgener et al., in press) SEAT 10-1 10000 traces B A Figure 2: Ice core being processed in field. C Figure 7: A) Radar echogram from SEAT10-3 with ice core location (solid red line) showing the stratigraphy over 1000 traces and 10000 traces (dashed red line is 1000 trace excerpt). Layering across the wider view are likely annual and were used for calculations. B and C show echograms used to determine accumulation at a low accumulation site SEAT 10-1 and high accumulation site SEAT 10-4, respectively. Figure 10: Comparison of age-depth scales from ice core and radar data. Figure 3: SEAT Traverse with radar sled carrying the CReSIS Ku-band and Snow radar shown on the far right. 4. Importance of Layer Picking Layer picking is the largest error in determining accumulation rate. Radar range bins in firn represent ~4.5 cm. Picking error is estimated at ± 5 bins. Natural spatial variation of radar power peaks between traces is up to 10 bins. 2. Radar Depth Scales Converting radar travel time to depth requires firn density and a dielectric model. In the near surface (top ~ 20 m), the dielectric model chosen and the measured density error or density model contribute 1 to 2% error on the calculated depth. This error is small compared to the errors associated with layer picking. 6. Conclusions Near-surface radar data can determine annual age-depth scales and accumulation rates. At high accumulation sites radar accumulation does not agree with SEAT 2010 ice cores data but agrees with other long-term spatially averaged accumulation rates. Acknowledgements Many people contributed to this research. Thanks to the field teams and CReSIS for their support of this project. This work was funded by a collaborative grant between the NASA Cryospheric Sciences Program and the NSF Antarctic Glaciology Program Figure 4: Depth dependence on dielectric model. Figure 5: Depth dependence on density error. Figure 8: Accumulation determined by the number of range bins for different density curves showing that minimizing the error in picking range bins has a greater reduction to changes in accumulation than density