IT 244 Database Management System
IT 244 Database Management System. Data Modeling 1 Ref: A First Course in Database System Jeffrey D Ullman & Jennifer Widom. System Development Life Cycle. The Database Development Life Cycle Consists of the following steps - investigation and analysis

IT 244 Database Management System
E N D
Presentation Transcript
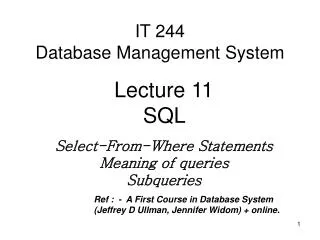
IT 244 Database Management System Data Modeling 1 Ref: A First Course in Database System Jeffrey D Ullman & Jennifer Widom
System Development Life Cycle • The Database Development Life Cycle Consists of the following steps - investigation and analysis - design the solution <-> test - construct / build <-> test - Implement / train - maintenance
Data Modeling • The process of designing a database begins with an analysis of: • what information the database must hold; • what processes involved • what information users required in what format; • what are the relationships among the component of those information. • A graphical representation of the essential data elements and their connections and relationships.
Data Modeling? • Most people involved in application development follow some kind of methodology. • A methodology is a prescribed set of processes through which the developer analyzes the client's requirements and develops an application. • Major database vendors and computer gurus all practice and promote their own methodology.
Data Modeling? • Some database vendors even make their analysis, design, and development tools conform to a particular methodology. • If you are using the tools of a particular vendor, it may be easier to follow their methodology as well. • Accordingly, CNS follows Oracle's CASE*Method application development methodology.
What is Data Modeling • A technique commonly used in analyzing the client's data requirements is data modeling. • The purpose of data modeling is to develop an accurate model, or a graphical representation, of the client's information needs and business processes.
What is Data Modeling? • The data model acts as a framework for the development of the new or enhanced database application. There are almost as many methods of data modeling as there are application development methodologies. CNS uses the Oracle CASE*Method for its data modeling.
Application Audience and Services • After agree on a scope and objectives statement, we find it helpful to identify the audience or users of the database application. • To whom do you offer the services we are modeling? • Who is affected by the application? Answers to these and similar questions help the participants stay in focus with the desired application results.
Entities • The next step in modeling a service or process, is to identify the entities involved in that process. • An entityis a tangible or real thing, person, object, event, activity of significance to the business, whether real or imagined, about which the business must collect and maintain data, or about which information needs to be known or held. • Equivalent to a Table
Entities • Whatever is chosen as an entity must be described in real terms. It must be uniquely identifiable. That is, each instance or occurrence of an entity must be separate and distinctly identifiable from all other instances of that type of entity.
Entities • For example – Student Record System First:- What type of information should be stored in the database? We can start by looking at information such as: • Personal information • Courses • The course fees • Text books and course materials • Department • Year and semester in which course offered • Sponsored or private • Student’s contact
Entities Second: What type of information do I need from the database once it is functional? • Class list • List of sponsored students • Students owing fees • Courses in a given semester • Student’s contact address • List of students taking a particular course
Entities From these information we can pick out the following possible entities. • Students • Fees • Courses • Textbook • Department
Entities • Symbol used is a rectangle Students
Attributes • After you identify an entity, then you describe it in real terms, or through its attributes. An attribute is any detail that serves to identify, qualify, classify, quantify, or otherwise express the state of an entity occurrence or a relationship. Attributes are specific pieces of information – data which need to be known or held. • Equivalent to fields or data item
Attributes • The attributes reflect the need for the information they provide. In the analysis meeting, the participants should list as many attributes as possible. Later they can weed out those that are not applicable to the application, or those the client is not prepared to spend the resources on to collect and maintain. The participants come to an agreement on which attributes belong with an entity, as well as which attributes are required or optional.
Attributes • The attributes which uniquely define an occurrence of an entity are called primary keys. If such an attribute doesn't exist naturally, a new attribute is defined for that purpose, for example an ID number or code.
Attributes • Attributes Symbols idnumber
Relationships • After two or more entities are identified and defined with attributes, the participants determine if a relationship exists between the entities. A relationship is any association, linkage, or connection between the entities of interest to the business; it is a two-directional, significant association between two entities, or between an entity and itself. Each relationship has a name, an optionality (optional or mandatory), and a degree (how many). A relationship is described in real terms. • An association between entities by action verbs
Relationships • Rarely will there be a relationship between every entity and every other entity in an application. If there are only two or three entities, then perhaps there will be relationships between them all. In a larger application, there are not always relationships between one entity and all of the others.
Relationships • Assigning a name, an optionally, and a degree to a relationship helps confirm the validity of that relationship. If you cannot give a relationship all these things, then perhaps there really is no relationship at all. For example, there is a relationship between Student and Fees. Each Student must pay fees for a particular course etc.
Relationships • Relationship Symbol pay
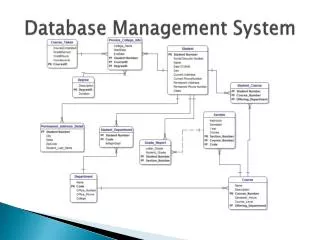
Entity Relationship Diagrams • To visually record the entities and the relationships between them, an entity relationship diagram, or ERD, is drawn. • An ERD is a pictorial representation of the entities and the relationships between them. • It allows the participants to easily see the information structure of the application. Later, the project team uses the ERD to design the database and tables.
Entity Relationship Diagrams • Knowing how to read an ERD is very important. If there are any mistakes or relationships missing, the application will fail in that respect. Although somewhat cryptic, learning to read an ERD comes quickly.
Entity Relationship Diagrams • Each entity is drawn in a box. • Each relationship is drawn as a line between entities. The relationship between Student and Fees is drawn on the ERD as follows:
Conceptual Design : E- R model Students Enroll in Course pay has offers Fees has Textbks Dept
Entity Relationship Diagrams • Since a relationship is between two entities, an ERD shows how one entity relates to the other, and vice versa. Reading an ERD relationship means you have to read it from one entity to the other, and then from the other to the first. • Each style and mark on the relationship line has some significance to the relationship and its reading. Half the relationship line belongs to the entity on that side of the line. The other half belongs to the other entity on the other side of the line.
Entity Relationship Diagrams • When you read a relationship, start with one entity and note the line style starting at that entity. Ignore the latter half of the line's style, since it's there for you to come back the other way. • A solid line at an entity represents a mandatory relationship. In the example above, each Student must pay a fee. • A dotted line at an entity represents an optional relationship.
Entity Relationship Diagrams • After some experience, you learn to ask the appropriate questions to determine if two entities are related to each other, and the degree of that relationship. • After agreeing on the entities and their relationships, the process of identifying more entities, describing them, and determining their relationships continues until all of the services of the application have been examined. • The data model remains software and hardware independent.
Multiway Relationships • A multiway relationship in an E/R diagram is represented by lines from the relationship diamond to each of the involved entity sets.
Roles in Relationships • One entity set appears two or more times in a single relationships • If so, we draw as many lines from the relationship to the entity • Each line to the entity represents a different role that the entity set plays in the relationship
Attributes on Relationships • Sometime it is convenient, or even essential, to associate attributes with a relationship, rather than with any one of the entity sets that relationship connects.
Example - HW • Let us design a database for a Student Record System, including information about these Entities - Students, Fees, Course, Textbooks,and Department; • Conceptual Design: • Draw the E/R diagram for this database. • Work out the type of relationships among the entities • Logical Design • Work out what are the attributes of each entity and name key for each table • Physical Design • How each data element will be defined in the DDL – names, data types and length with any constraints
Summary • Data Modeling • SDLC • What is Data Modeling • Application Audience and Services • Entities • Attributes • Relationships • Entity Relationship Diagrams • Conceptual,Logical and Physical Design